In this blog I’d like to take you through my learnings from last week when I finally started with canvas. I hope that, after reading this blog, I will have convinced you that canvas is a really good visualization option if you need better performance than d3.js can give you and that it’s actually not that difficult to learn canvas.
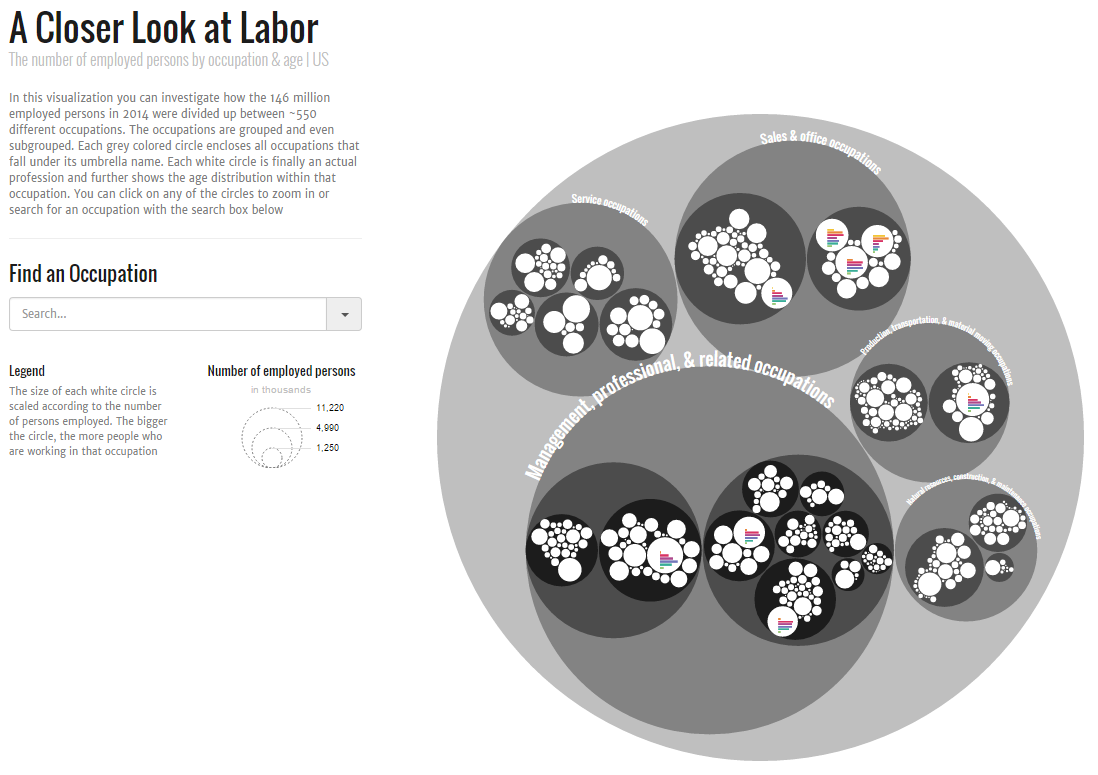
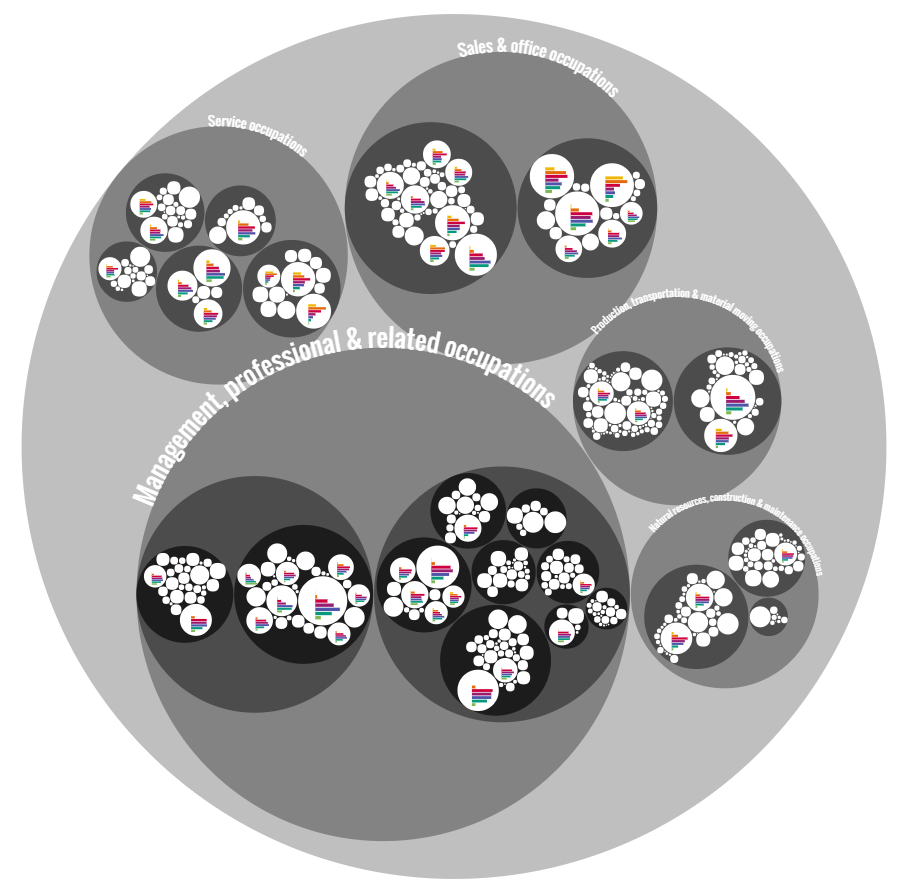
Last September I made a data visualization project about the age distribution across all ±550 occupations in the US. I came up with the idea of combining the standard d3.js circle pack layout (based on the work from Wang et al. (2006)) with mini bar charts, or small multiple packing as I started calling it. The size of the circles encodes how many people are employed in that occupation and the bar chart within the circle gives another level of detail by showing you how these people are spread across 7 different age groups.

The number of elements comes from 550 occupations * (7 age bins * 3 elements per age bin + 2 title sections)
As a d3.js enthusiast I naturally starting building away with SVG elements. But it became apparent pretty early on that this visualization would be creating a lot of elements, about 13000 to be exact. And that took a long time to load and draw when you land on the page. About 5 seconds on a desktop. I thought that wouldn’t be too bad since the visual worked okay after this initialization. But after I put it online I could finally test it on mobile and that was disaster. I think it took about 30 seconds to load and about 15 seconds to respond after you selected a circle to zoom into ಥ_ಥ
In version 2.0 I implemented all kinds of tricks that would make sure that only the visible pieces were being scaled when you selected a circle. This already brought some noticeable performance improvements, but I knew that people wouldn’t stick around to wait even a few seconds. I had to make drastic changes, but I wasn’t jumping at the idea of looking into canvas. I guess I was a bit afraid that I wouldn’t be able to get my head around the programming style of canvas. I had heard that it would be on a more abstract level than d3.js. Like having to go into C when you’re perfectly comfortable with R (which I have done, but didn’t enjoy). Thankfully, I imagined it to be so much worse than it actually was.
Two months later, after watching the OpenVis Conference talk by Dominikus Baur on Weighing Performance against pain: SVG, Canvas and WebGL I finally gathered the courage to start learning canvas. Perhaps the occupations piece was too complex for a very first project, I could fail quite easily, but I knew that having a goal would give me best drive to keep going.
In the end it took me about 25 hours to rebuild the entire piece in canvas. And damn, it was fast. Immediate loading and click/touch response on both desktop and mobile. If you want to compare performance, here are the two versions
From the reactions I got on the canvas version on Twitter, I am not the only d3.js oriented person interesting in learning canvas. Therefore, I wanted to summarize my process, resources I couldn’t have done this without, and my own learnings in more than 140 characters.
The Basics
The canvas is actually an HTML element like the div, or maybe even more alike, the img. However, in combination with JavaScript, which can access the HTML5 Canvas API, it can be used to draw graphics. One big difference with d3’s SVG based method, is that with canvas you fill pixels, the resulting visual on the screen is practically a png image. You can’t select anything or any element as you can with SVG.
The big advantage of canvas over SVG is that you can create thousands of separate elements without it really affecting performance, since the DOM only sees one canvas element. However, because it is based on pixels the rendering will not be as sharp as SVG. On old screens with poor resolution the image might look slightly fuzzy. The code below shows you how you can start by creating the canvas element itself and setting its width and height.
<canvas id="canvas" width="400" height="400"></canvas>

<script>
    var canvas = document.getElementById('canvas');
    var context = canvas.getContext('2d');
</script>
Or do it the d3.js based way in which you append a canvas element to a div instead of an SVG
<div id="chart"></div>

<script>
    var canvas  = d3.select("#chart").append("canvas")
    .attr("id", "canvas")
    .attr("width", 400)
    .attr("height", 400);

    var context = canvas.node().getContext("2d");
</script>
After creating the canvas, either in the HTML itself or by using d3.js code a context has to be added. And I couldn’t have explained it better than html5canvastutorials:
So it’s the context variable that you will apply all of your dataviz elements to.
Placing a piece of text: First set the fillStyle of the context because the text will be drawn with that color. Then it is as simple as using the fillText command with the actual text string and x and y location. If you want to format your text a bit more, there are the font, textAlign and textBaseline commands that come in handy.
//Drawing Text
context.fillStyle = "red";
context.fillText("Text",x,y);

//There are several options for setting text
context.font = "30px Open Sans";
//textAlign supports: start, end, left, right, center
context.textAlign = "start"
//textBaseline supports: top, hanging, middle, alphabetic, ideographic bottom
context.textBaseline = "hanging"
context.fillText("Text",x,y);
Draw a rectangle filled with a specific color: First set the fillStyle of the context, then draw a rectangle with your desired x and y location and width & height. The current fillStyle of the context will automatically be applied. If you also want to stroke the rectangle, follow the same idea as the fill, but with strokeStyle
//Drawing a rectangle
context.fillStyle = "red";
context.fillRect(x, y, w, h);
//Optional if you also want to give the rectangle a stroke
context.strokeStyle = "blue";
context.strokeRect(x, y, w, h);
Draw a circle filled with a specific color: There is not fillRect equivalent for a circle. Instead a circle is seen as a path. First set the fillStyle, then draw a circle with an arc command. This is not automatically filled, therefore call a fill(). The beginPath command is needed as well if you want to draw multiple separate paths/circles, it will flush the possible subpaths that were still in the context. So it sees the circle as a new element to be drawn. The closePath command isn’t needed in this particular instance, but I think it makes the code clearer
//Drawing a circle
context.fillStyle = "red";
context.beginPath();
//context.arc(x-center, y-center, radius, startAngle, endAngle, counterclockwise)
//A circle would thus look like:
context.arc(x, y, radius, 0,  2 * Math.PI, true);
context.fill();
context.closePath();
That isn’t all of course. Just like the richness of shapes you can draw with SVG paths, you can create all sorts of things with canvas paths as well. However, the text, rectangle and circle element were all that I needed for the Occupations piece and this is only an introduction of course.
The Start
How do I combine these canvas commands with data, transitions and all the things happening in my SVG based version? Well, I guess almost everybody does this, I started by looking for tutorials. But I was very specific, I wasn’t looking for general canvas things, I was looking for tutorials that come from a d3.js setting. That used d3.js in one way or another together with canvas to create a visual. That seemed like the most gentle introduction for me. I was able to find a few snippets, but there were two tutorials that really made a big impact. The first one:
- Working with D3.js and Canvas: When and How written by Irene Ros
Such an excellent tutorial with useful code snippets! It goes through 3 different ways in which you can combine d3.js with canvas. From d3 playing a very big role, to it only being used for some data/layout initialization. I started with the option in which d3 played a big role of course, not straying too far from what I was used to.
I was amazed by how easy it was to create something actually based on data. You do everything as you’re used to with d3; setting widths, creating scales, reading in the data. However, as we saw in the previous section, instead of creating an SVG, you create a canvas and a context onto which you will draw all elements.
See the working block that uses the code below here
Please read Irene’s tutorial for a more elaborate explanation, but I’ll show you how to do it with a d3 layout just so you’ll have more examples to use for inspiration. In essence you create a normal d3.js circle pack layout, but you don’t append it to the (non-existent) SVG as you would normally, but append it to a dummy element. This way it won’t actually be drawn into the DOM. Finally, you loop over all the nodes/circles of the circle pack and use their attributes to draw circles on the canvas. Apart from some color scale and variables initialization you can see the full code below. Just browse through it, the code is pretty self explanatory if you’re familiar with d3
//...
//Create set-up variables, scales, initialize pack layout...
//Create canvas and context variables...
//...

//////////////////////////////////////////////////////////////
////////////////// Create Circle Packing /////////////////////
//////////////////////////////////////////////////////////////

//Create a custom element, that will not be attached to the DOM
//to which we can bind the data
var detachedContainer = document.createElement("custom");
var dataContainer = d3.select(detachedContainer);

d3.json("occupation.json", function(error, dataset) {
    //Create the circle packing as if it was a normal D3 thing
    var dataBinding = dataContainer.selectAll(".node")
        .data(pack.nodes(dataset))
        .enter().append("circle")
        .attr("class", "node")
        .attr("cx", function(d) { return d.x; })
        .attr("cy", function(d) { return d.y; })
        .attr("r", function(d) { return d.r; })
        .attr("fill", function(d) {
            return d.children ? colorCircle(d.depth) : "white";
        });

    //Select our dummy nodes and draw the data to canvas.
    dataBinding.each(function(d) {
        //Select one of the nodes/circles
        var node = d3.select(this);

        //Draw each circle
        context.fillStyle = node.attr("fill");
        context.beginPath();
        context.arc(node.attr("cx"), node.attr("cy"), node.attr("r"),
                    0,  2 * Math.PI, true);
        context.fill();
        context.closePath();
    });
});
It took me a few hours to really appreciate/face that it could be done faster. See the working version of the code below here
However, it can be done even more easily if we take out that d3-appending-to-a-dummy-element piece completely. We don’t need it! The code below will create the exact same result as above, but with less lines and less creation of dummy elements. The nodes dataset already contains all of the location information that we need to create the circles, the x, y and r, the depth to define the color. So I can just loop through that.
//...
//Create set-up variables, scales, initialize pack layout...
//Create canvas and context variables
//...

//////////////////////////////////////////////////////////////
////////////////// Create Circle Packing /////////////////////
//////////////////////////////////////////////////////////////

d3.json("occupation.json", function(error, dataset) {
    var nodes = pack.nodes(dataset);

    //Loop over the nodes dataset and draw each circle to the canvas
    for (var i = 0; i < nodes.length; i++) {
        //Select one of the nodes/circles
        var node = nodes[i];

        //Draw each circle
        context.fillStyle = node.children ? colorCircle(node.depth) : "white";
        context.beginPath();
        context.arc(node.x, node.y, node.r, 0,  2 * Math.PI, true);
        context.fill();
        context.closePath();
    };
});
I do have to note that the examples used in Irene’s tutorial and the circle pack layout above are all based on simple SVG elements; either rectangles, circles or text. I don’t yet know how easy it is to draw SVG defined paths onto a canvas, such as those seen in a chord diagram for example.
The Animations
At this point, I had the static version working, but I needed a zoomable circle pack. This introduced two challenges: I needed to animate the elements with a canvas that can only be static & I needed a way to link the circle on which the viewer clicks to the underlying data. The problem with the latter comes from the fact that a canvas is really just a pixel rendering. You can request on what x and y location you clicked and even the color of that pixel. But how to link that to the circle? The elegant solution is where the second super tutorial came in to help (also found on the Bocoup website):
- Needles, Haystacks, and the Canvas API written by Yannick Assogba
You can also find a great example of the difference between performance of canvas and d3.js in Yannick’s blog by comparing the SVG based rendering and canvas based rendering examples if you crank up the number of rectangles to a few thousand.
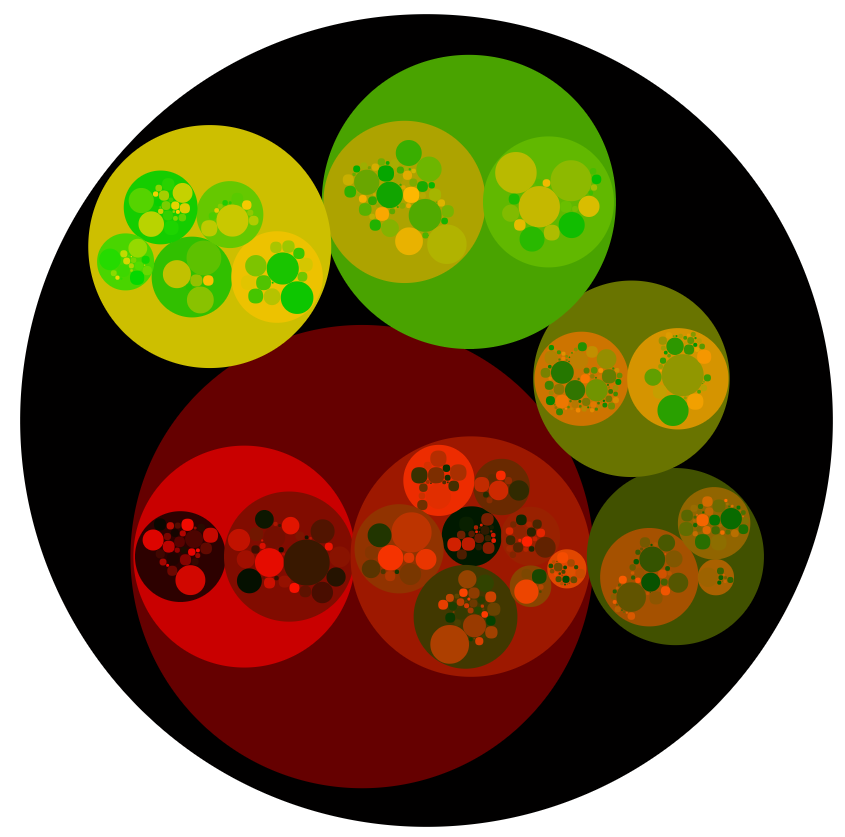
I would’ve never thought of this myself or knew it was even an option. The thing is, you can request the color of the pixel that was clicked on. So, you create a second canvas in which each circle has a different color but make it invisible. You also need a variable that keeps track of the node color and the corresponding node data. Then, when somebody clicks on the canvas, you request the unique color of that pixel and use this to find the node data connected to the color. Again, please read the full tutorial for more explanation and full code examples that can be used almost without changes. For the circle pack layout the hidden canvas would look like the image below if I were to make it visible

To come back to tackling that first challenge of creating animations with a static canvas. The solution idea is fairly simple, just draw the canvas and destroy it about 60 times per second and always base the attributes of the circles or rectangles in the new canvas on the changed x and y coordinates.
Because d3 is actually so good in doing transitions, calculating for you how to go from the starting state to the end state, I actually went back to the d3-is-heavily-involved version. While d3 was performing a zoom into a circle on the dummy pack layout nodes, the canvas would be redrawn continuously. It would always use the latest x and y attributes of these nodes/circles. You can find the full version in this block. The new pieces of code come primarily from the two tutorials.
However, on my laptop at least, the animation looked choppy, not smooth, especially when zooming in on a small circle. Thankfully, Stephan Smola came to my rescue by creating a version in which d3 is downsized again, but where he used d3 to create a custom interpolation function between a start and end point. The animation, although following a slightly odd trajectory, was looking perfect. With his code as my base I was able to make a few adjustments and used d3’s handy d3.interpolateZoom function to create exactly what I was looking for. You can find the working version here. Without Stephan’s help I don’t think I would’ve come up with the idea of building a separate interpolation function even though the resulting code required is not even that complicated.
The Rest
The curved texts gave a bit of a headache, but thankfully somebody had already created a canvas function for this.
How could I say “the Rest” if I still haven’t even made any bar charts yet? The visual is still far from complete! But in terms of learning canvas, the part above was 90% of what I had to get my head around. The bar charts came down to creating rectangles and text labels at the right locations, figuring out the best font sizes based on circle radius and when to show or hide bar charts based on the choices the viewer made. All of which I had already calculated and created for the d3.js version. It was just a matter of copying and adjusting things, but it didn’t require major problem solving headaches. And I could also copy the HTML layout from the d3.js version.

The Learnings
- Drawing a circle, rectangle or text in canvas is almost easier to understand than doing the same in d3.js
- Both click and mouse over functionality could be applied fairly straightforward by using unique colors for each clickable element / circle (if you use the code from Yannick Assogba’s blog)
- Transitions can be simulated by redrawing the canvas many times a second. As long as you update the data that you use for your rectangles and circles (the
x,y,width,heightand/orradius) the redrawing will seem like a smooth transition - What worked best for me in terms of performance was using d3 for the many small (but important) functions and variables such as creating the canvas and scales, running the timer during updates and calculating interpolations. However, I didn’t use d3 for any actual drawing. I did this with the pure canvas based on the data that the d3 pack layout supplied
- If your visual is not animated/transitioning every second, don’t keep redrawing the canvas as this will be hard on your CPU. Instead only start the redrawing of the canvas function whenever a change has to happen, then keep it running until the transition is done. For example, you can use the
d3.timerfunction to continuously redraw the canvas during a transition. Ad3.timercan be stopped if the function itself returnstrue. So initiate a variablestopTimertofalsewhen you want a transition to begin, start thed3.timerfunction, let it run and once the duration is over, set thestopTimertotrueand thed3.timerwill stop.
The Resources & Code
A list of the online resources that I used for general understanding (apart from stackOverflow questions for very specific things like curved texts in canvas):
- Working with D3.js and Canvas: When and How written by Irene Ros
- Needles, Haystacks, and the Canvas API written by Yannick Assogba
- The D3 reduced Zoomable Circle Packing with custom interpolation by Stephan Smola
- Creating figures with canvas on understanding how d3 layouts work together with canvas
- A small JSFiddle with a canvas bar chart
And even more resources that seemed useful, but that I didn’t really use after all
- DOM-to-Canvas using D3 by Mike Bostock. I was confused by the whole custom thing so I tried to stay away from it at the start. But it’s still a short piece of code that’s very useful now that I understand canvas a bit more
- Collision Detection in Canvas by Mike Bostock. If you compare this code to the SVG version you can really see how little there had to be changed
- Drawing on Canvas. A true canvas tutorial. It’s a bit long, but it seems very complete
- The W3C Canvas page. Useful when you want to know all of the options available
- The html5 canvas tutorials. The links on the left are nice short code snippets that are easy to understand
- The HTML5 canvas cheat sheet. Don’t look at this while you’re still learning. At first it didn’t make any sense to me. But after you’ve created a few canvas elements you’ll understand (most of) it
All of the working examples shown in this blog together in one list
- Circle Packing at its most Basic - Canvas & d3.js
- Circle Packing at its most Basic - Canvas only
- Zoomable Circle Packing with Canvas & d3.js - Heavily based on d3
- Zoomable Circle Packing with Canvas & d3.js - Final
- And finally the canvas based Occupations piece, with 13000 elements and still fast
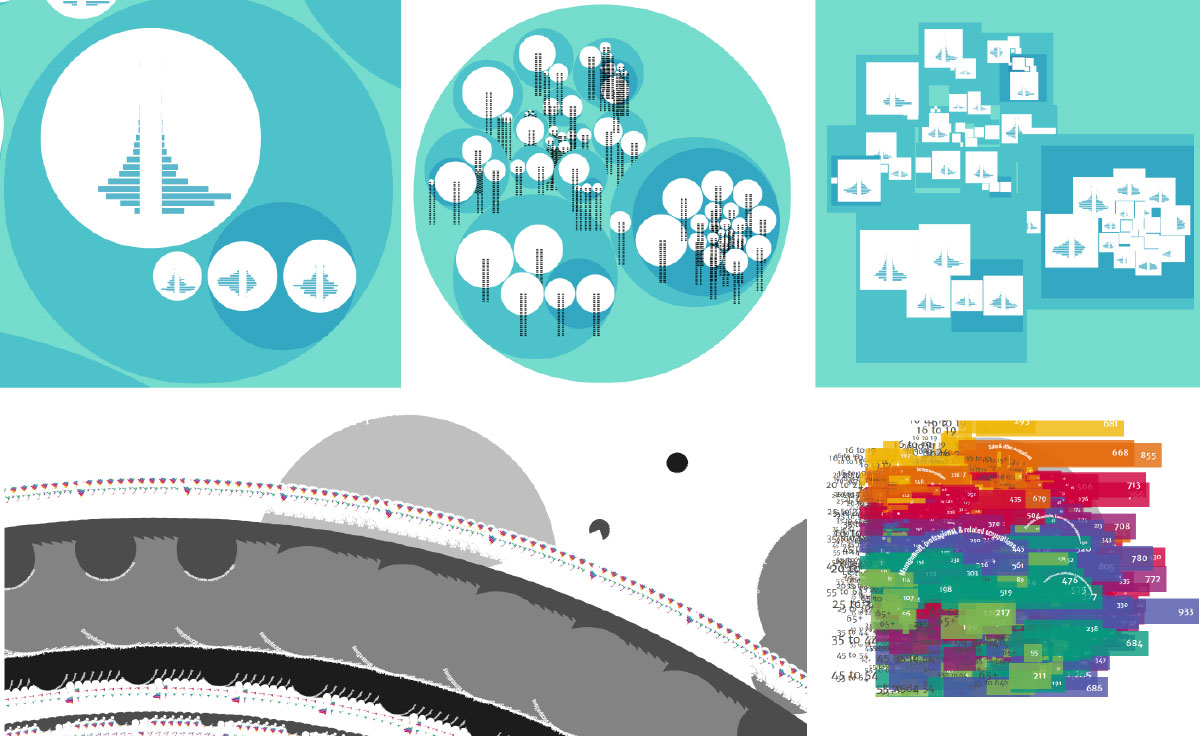
I hope this blog was able to convince you that canvas is a good alternative for d3 when you are dealing with a lot of SVG elements. But also that it helped you make the next step in starting with canvas! And just because it’s fun, here are some screenshots of my development (including the one in d3.js) where not everything was going according to plan or when the design still looked very different
