In my previous post I spoke a bit about a program I wrote in R that helps me perform self organizing map (SOM) analyses and create heatmaps. From the cleaned data file all the way to the visualization and analysis of the heatmaps.
If you want to know how to add boundaries to heatmaps, see my next post that deals specifically with the boundaries once you have your heatmap all set up.
One minor issue with the R program was that I wasn’t allowed to hand over the part to analyse the SOM heatmaps to the client. So all they got was a PowerPoint with static images and our strategic findings about the (client) segmentation. Still very interesting of course, since usually we show them insights they’ve never found before. Or has never been proven or not shown in that amount of detail. But I wanted to develop something a bit more sexy I guess.
Having tried to use d3.js a bit in the past few months, I knew that creating a webpage where the client can go through all the heatmaps and have a bit of analyzing capabilities would be just what I was looking for and d3.js makes almost everything look good.
Try hovering the hexagonal heatmap below 。^‿^。
I used the d3 hexbin plugin, even though I have nothing to bin. By using this plugin in a slightly different way than intended I do not have to make a function that draws each hexagon myself.
I have to admit that d3 (but especially JavaScript) has been one of the most difficult programming languages I’ve tried to learn. Quite a different structure from R and IDL and even VBA and SAS came to me faster.
Hexagons 101
There really is only one difficult step in the whole process and that is calculating the centers of each hexagon. But to do this I first need to know the map dimensions (number of rows and columns) and decide what the radius of one hexagon needs to be.
Say I want the heatmap to fit inside a rectangular shape of 850 by 350 pixels and my map has 30 columns and 20 rows. The maximum radius that a single hexagon can have depends on which value is smaller; the radius so 30 hexagons will fit into 850px or the radius needed to still fit 20 hexagons inside 350px.
Radius, height and width of a hexagon are thankfully all very much related. This site really helped me to get an understanding of hexagons and their dimensions in a grid. Say hexRadius is the radius of a hexagon, it is the circle that can be drawn so all six corners touch the circle
- The height of a hexagon =
hexRadius * 2 - The width of a hexagon =
hexRadius * Math.sqrt(3)
//The height of the total heatmap will be
num_rows * 3/2 * hexRadius + 1/2 * hexRadius
//which is the same as
(num_rows + 1/3) * 3/2 * hexRadius

//The width of the total heatmap will be
num_columns * Math.sqrt(3) * hexRadius + Math.sqrt(3)/2 * hexRadius
//which is the same as
(num_columns + 1/2) * Math.sqrt(3) * hexRadius
My final formula, that calculates the ‘best’ hexagonal radius is then the following:
//SVG sizes and margins
var margin = {
    top: 50,
    right: 20,
    bottom: 20,
    left: 50
},
width = 850,
height = 350;

//The number of columns and rows of the heatmap
var MapColumns = 30,
    MapRows = 20;

//The maximum radius the hexagons can have to still fit the screen
var hexRadius = d3.min([width/((MapColumns + 0.5) * Math.sqrt(3)),
    height/((MapRows + 1/3) * 1.5)]);
Getting the center coordinates
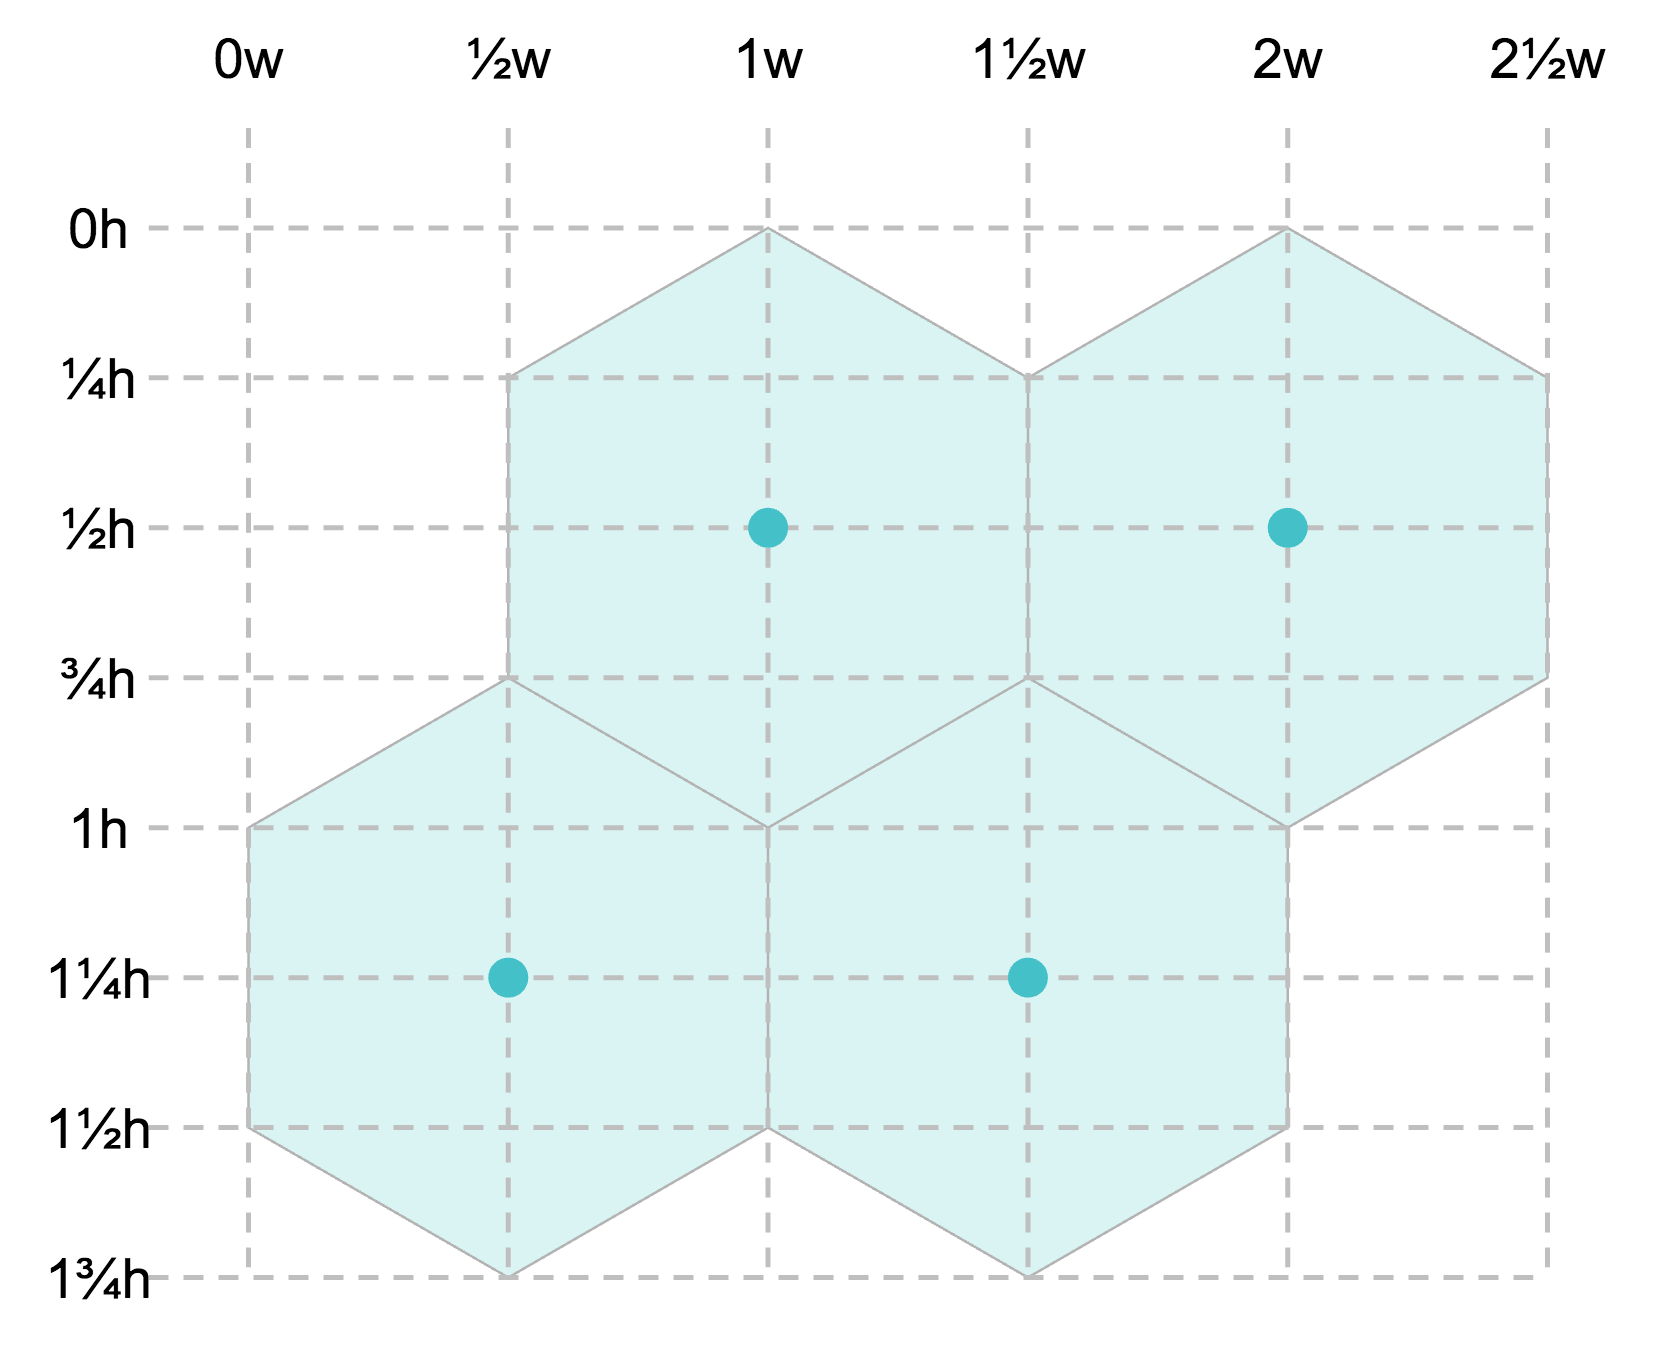
Now that we finally have a radius that will make sure the entire map fits the available space, we can calculate the centers of each hexagon. Using the image below we can see that two hexagons are 1 width apart horizontally (= Math.sqrt(3) * hexRadius) and 3/4 height apart vertically (= 3/2 * hexRadius).

However, you do need to take the x-based offset into account for each second row, where everything is moved half a hexagon’s width to the right (or left, whatever you prefer). Calculating the centers is easily done by the following for loop:
//Calculate the center position of each hexagon
var points = [];
for (var i = 0; i < MapRows; i++) {
    for (var j = 0; j < MapColumns; j++) {
        var x = hexRadius * j * Math.sqrt(3)
        //Offset each uneven row by half of a "hex-width" to the right
        if(i%2 === 1) x += (hexRadius * Math.sqrt(3))/2
        var y = hexRadius * i * 1.5
        points.push([x,y])
    }//for j
}//for i
Now we have an array that holds all [x,y] center coordinates, which is all you need. The hexbin plugin deals with converting this into an actual hexagon path with 6 sides. (Thanks to Severin Zahler for notifying me of an error in my thinking and making me realize that the horizontal offset is needed.)
Drawing the hexagonal grid
Now lets create a placeholder for the heatmap; an SVG and initiate the hexbin plugin
//Create SVG element
var svg = d3.select("#chart").append("svg")
    .attr("width", width + margin.left + margin.right)
    .attr("height", height + margin.top + margin.bottom)
    .append("g")
    .attr("transform", "translate(" + margin.left + "," + margin.top + ")");

//Set the hexagon radius
var hexbin = d3.hexbin().radius(hexRadius);
And the last piece of code that will draw the hexagonal grid for you. See how the data step gets hexbin(points), not just points
//Draw the hexagons
svg.append("g")
    .selectAll(".hexagon")
    .data(hexbin(points))
    .enter().append("path")
    .attr("class", "hexagon")
    .attr("d", function (d) {
        return "M" + d.x + "," + d.y + hexbin.hexagon();
    })
    .attr("stroke", "white")
    .attr("stroke-width", "1px")
    .style("fill", "teal");
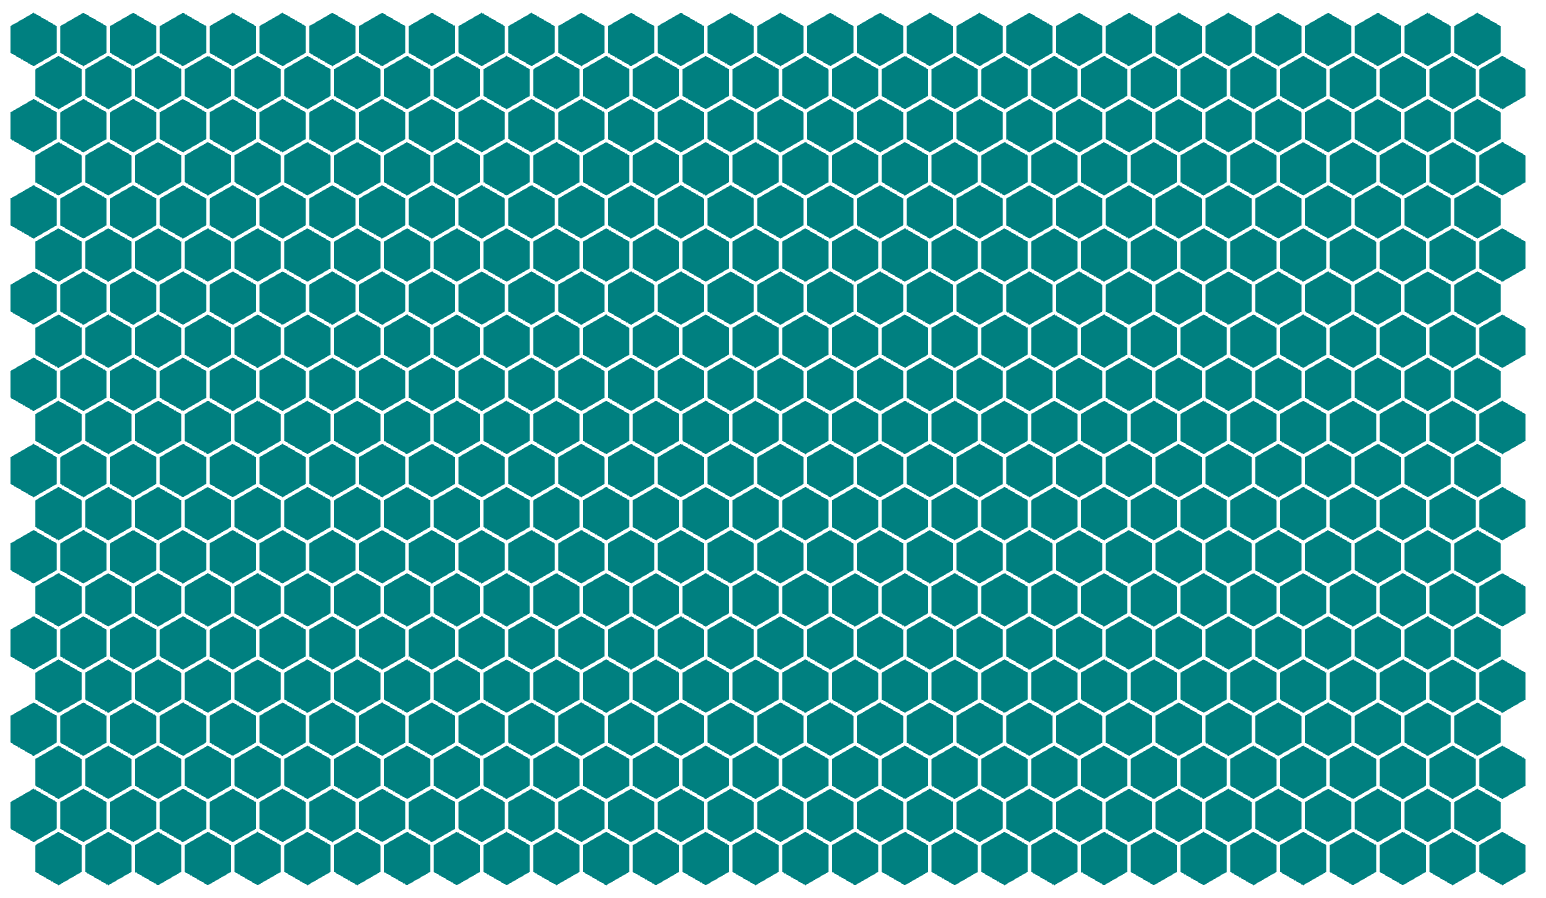
You should now have something like the image below, a teal colored grid

Colors
I pre-calculated the hex colors in R.
Now that we have a grid, let’s add some color, which is the easy part actually. I started with an array of color hex codes, instead of numeric data, just to make my life easier.
Just replace the line where you have set the fill to one color for all hexagons, to one that depends on the iterator i of the hexagon number. Now the color of the i’th hexagon will be filled with the i’th entry of the array color
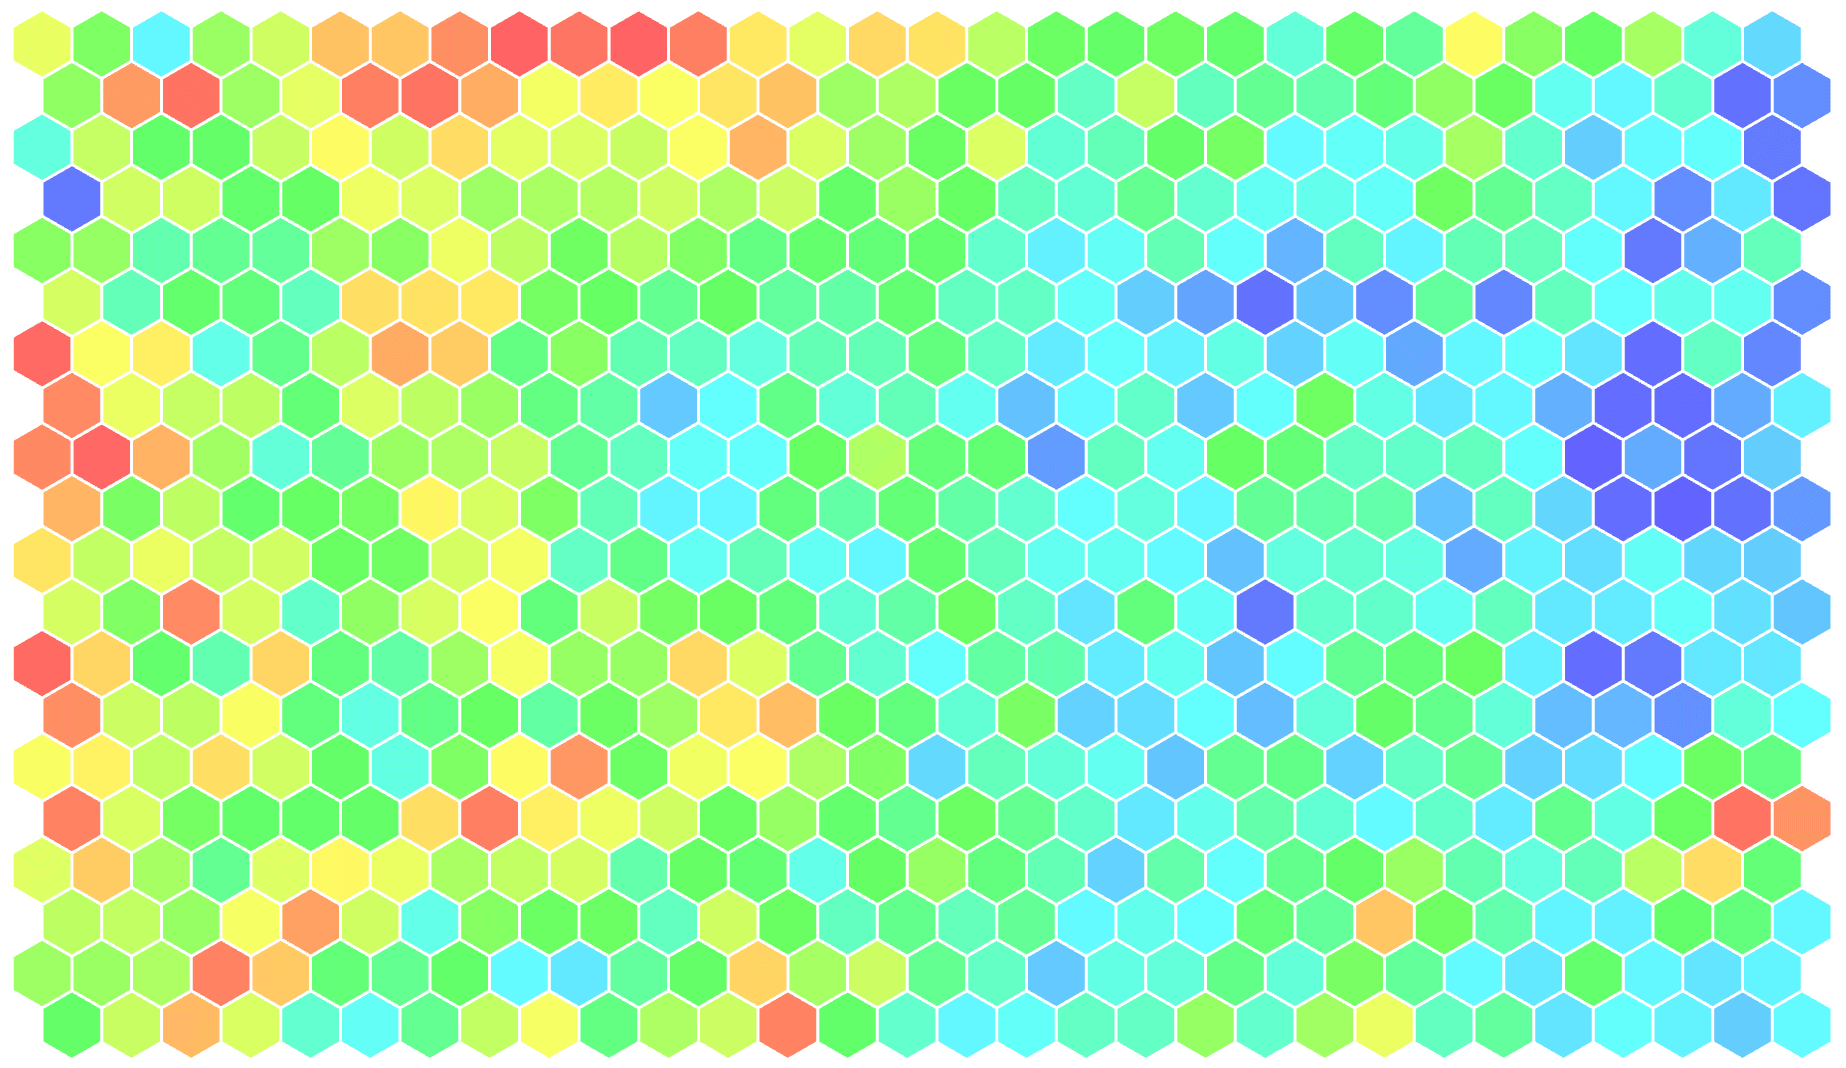
.style("fill", function (d,i) { return color[i]; })The heatmap below is the result of adding a splash of color. It actually represents the expected revenue of a supermarkets in the Netherlands. Red being a lot of revenue and blue being not so much revenue

You can find the code and example in this Observable (or if you prefer bl.ocks, here is that version). I added some other lines of code to have a nice mouse over event, a bit of styling, etc.
Final result
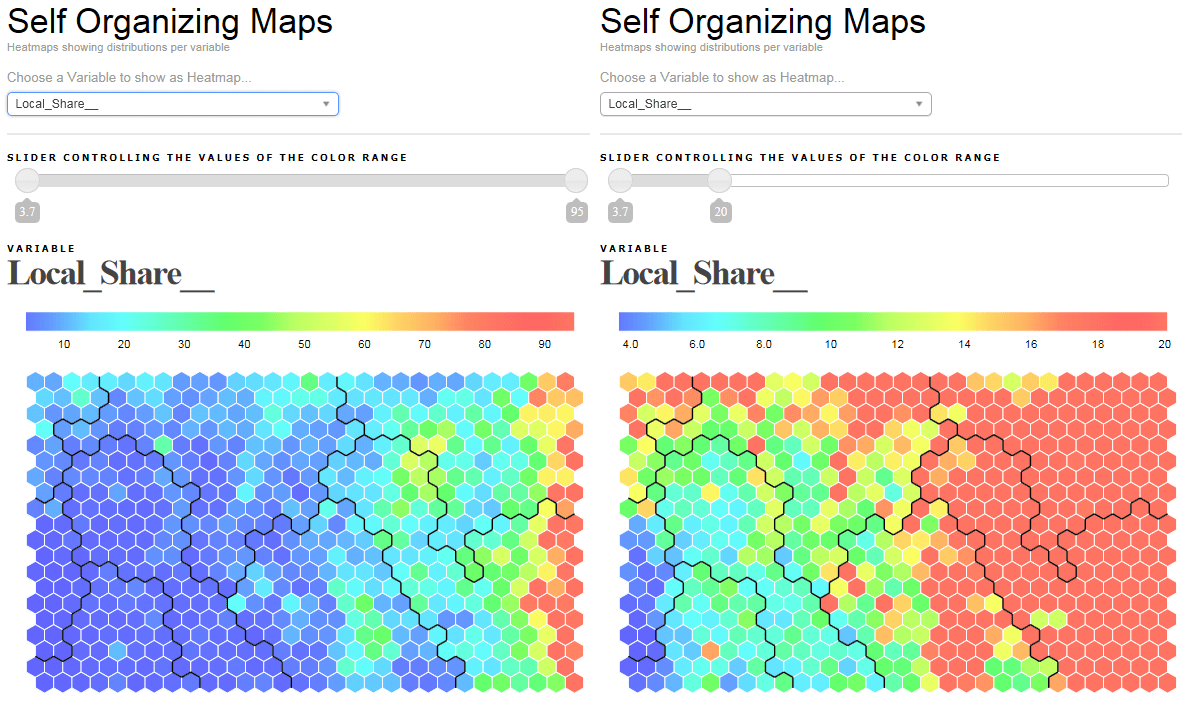
Below you can see what I eventually made using d3. It now has options to show multiple heatmaps, where you can pick a variable from the drop down list. There is a legend that tells you which color belongs to which value. And finally, there is a slider that gives you the option to tweak the color boundaries. Slide the left handle towards the right and the number below it shows where dark blue is reached, every value below the one from the handle will be dark blue as well. The heatmap colors get updated while you slide it. This gives me the chance to investigate a portion of the map that is all primarily one color, by adjusting the handles I can tweak the colors to show more detail in that section. You can see the result of sliding a handle in the two images below

In my next post I explain how to calculate the black lines that form the boundary between the heatmap segments with just one ‘simple’ mathematical principle.