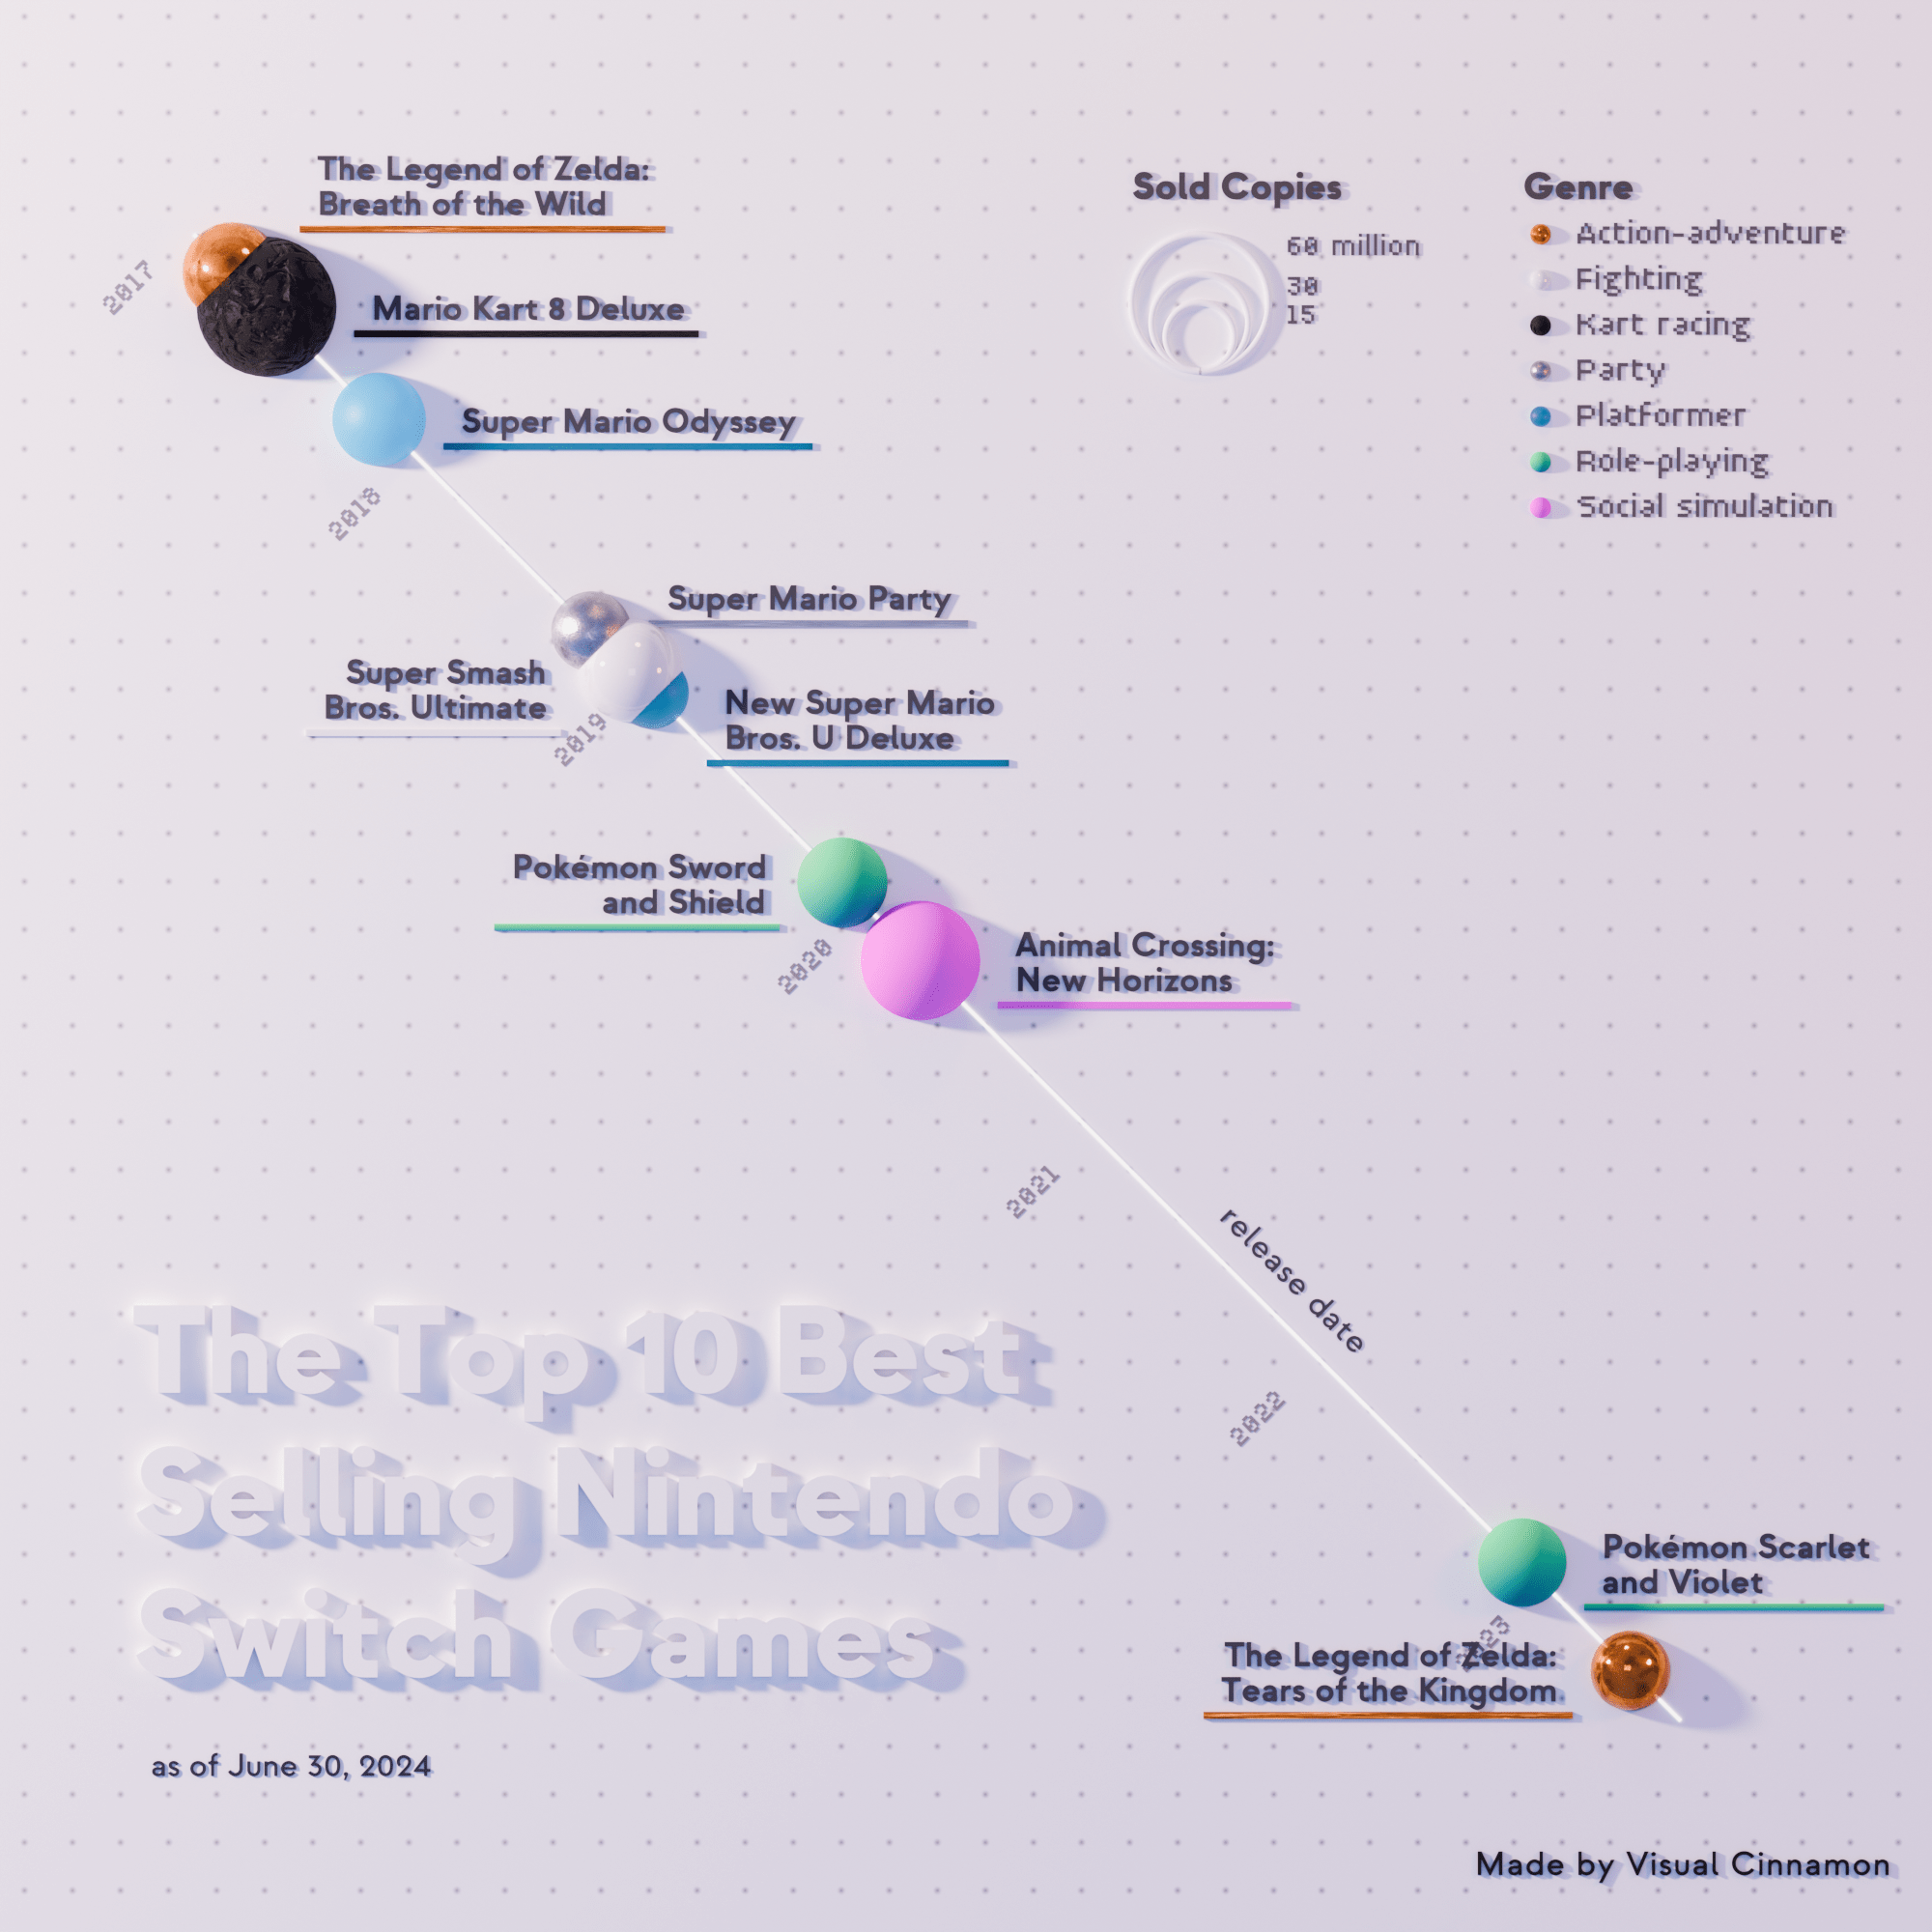
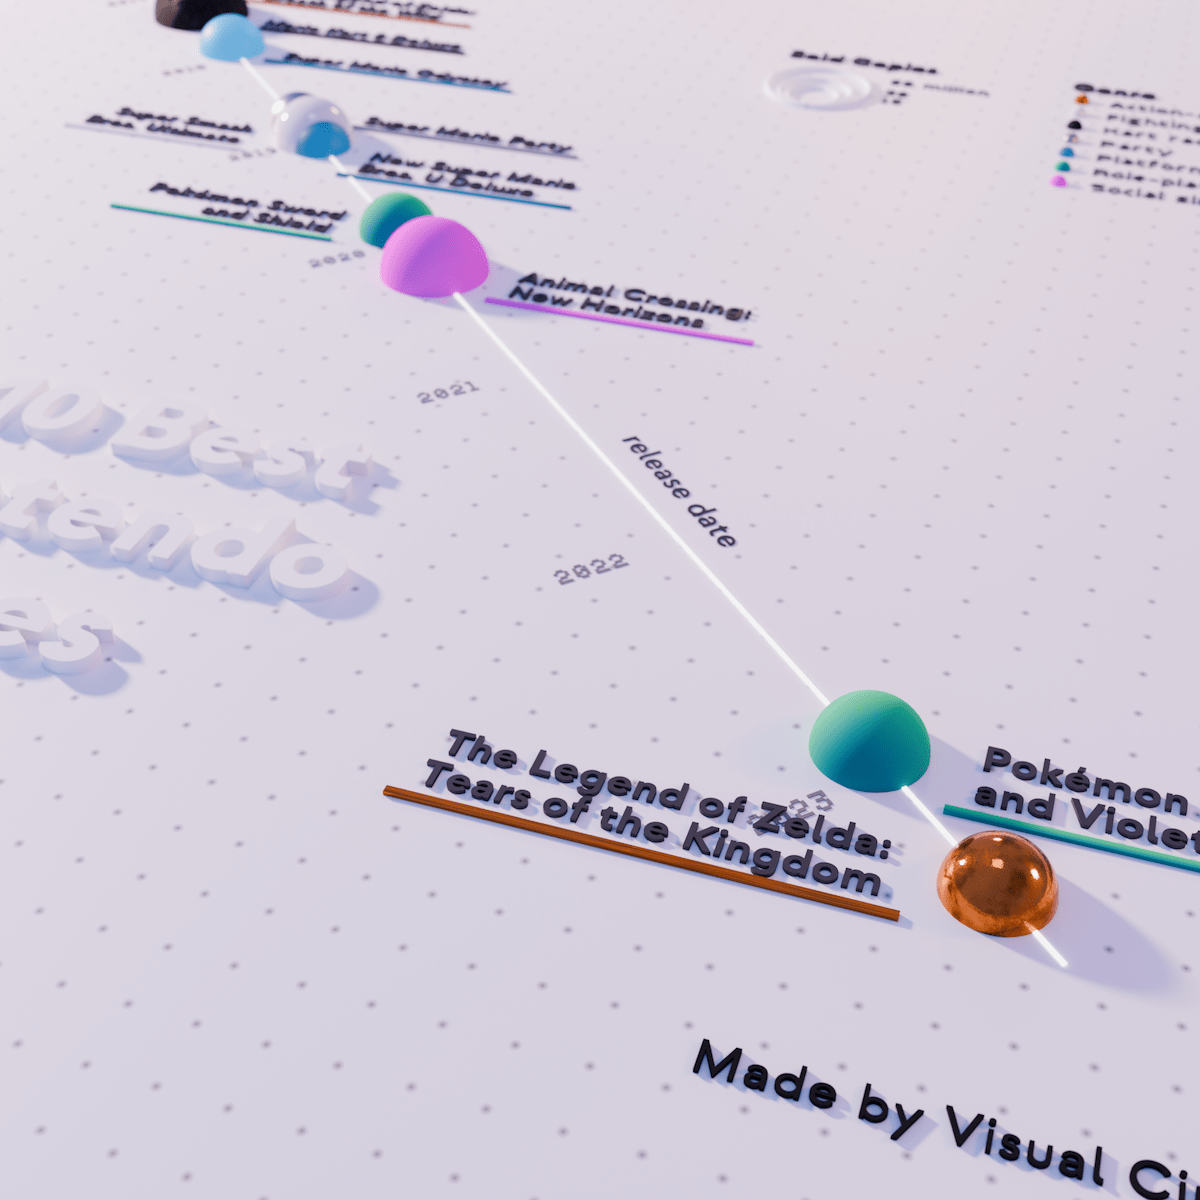
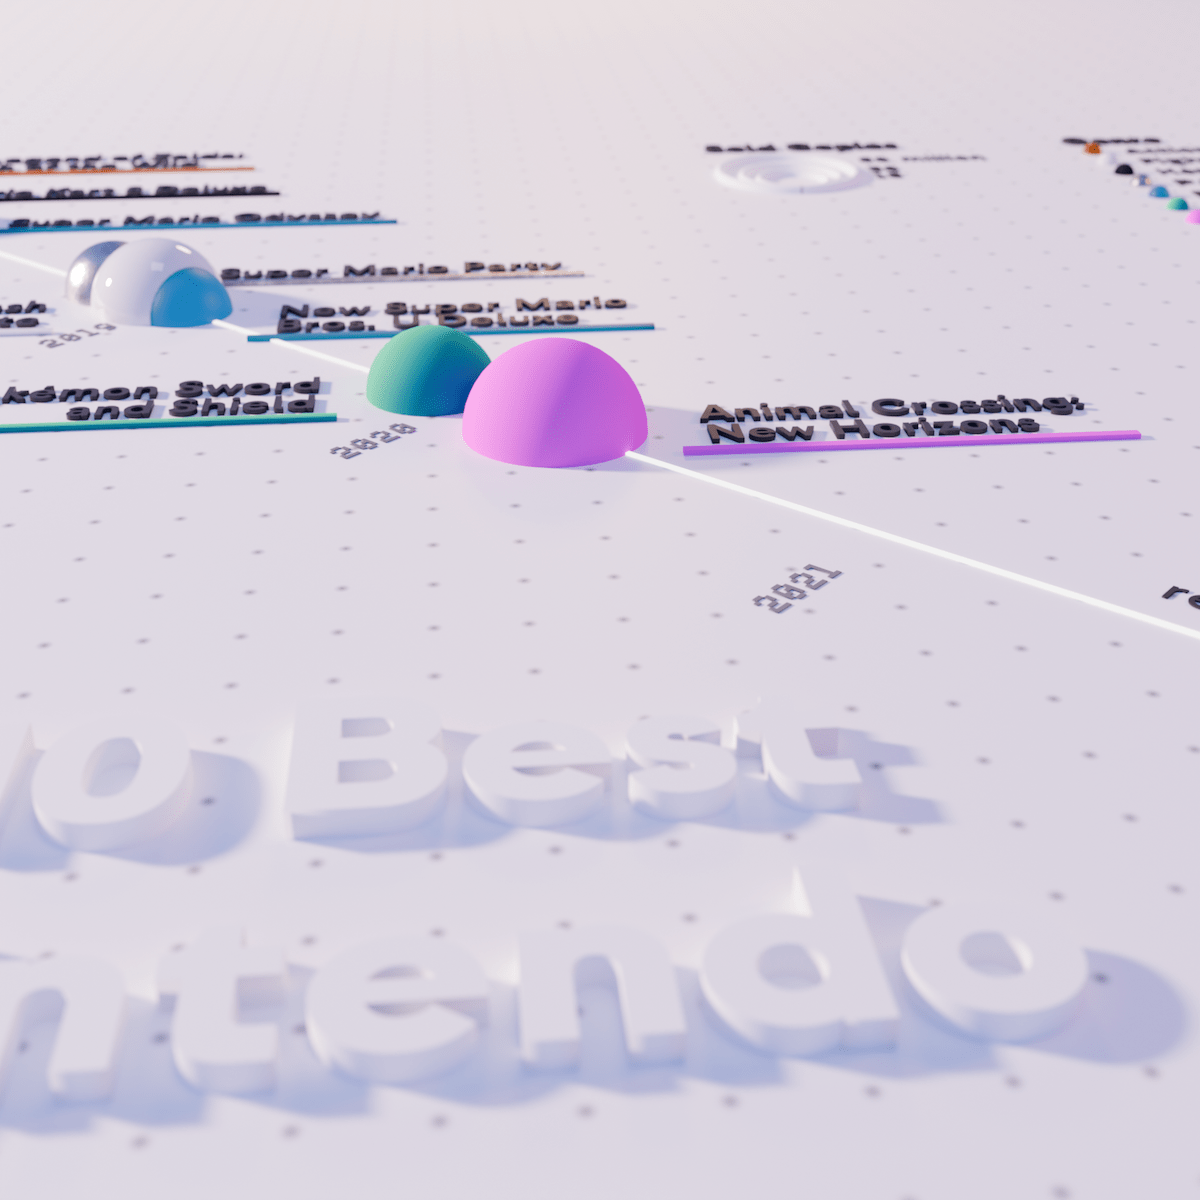
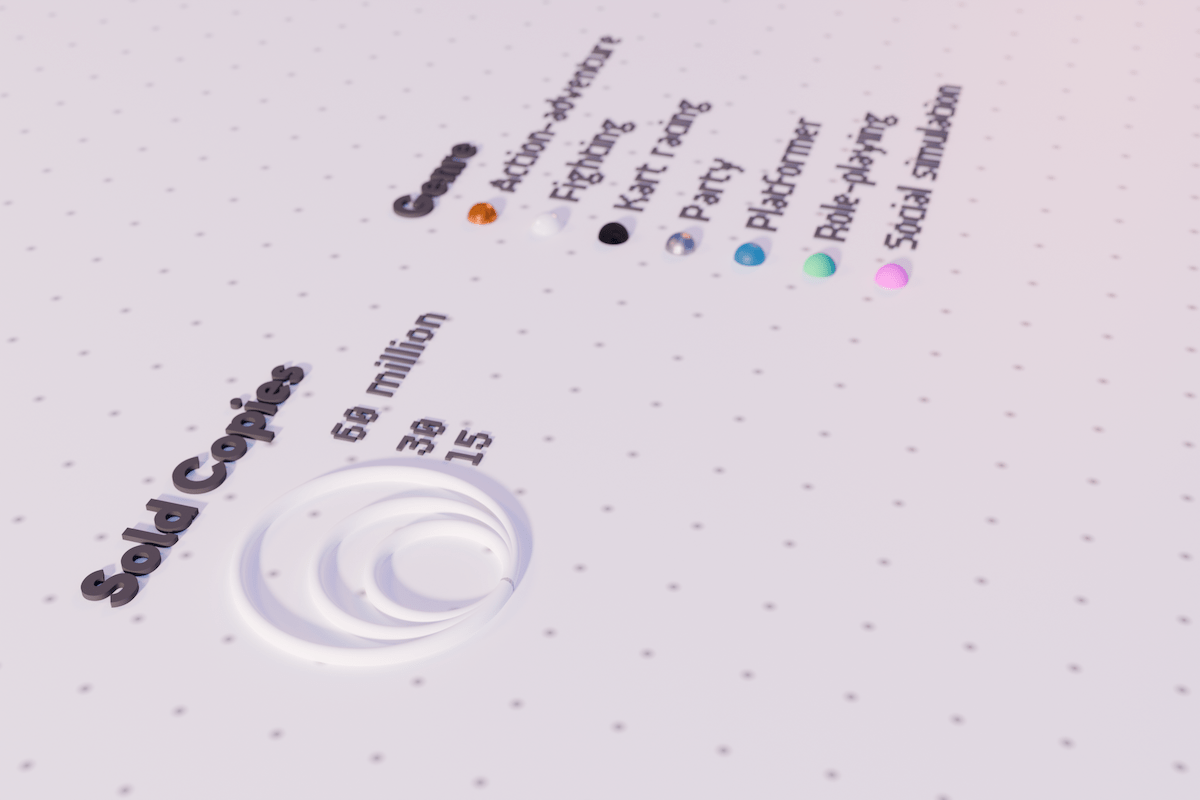
A visualization about the top 10 best-selling Nintendo Switch games, as of June 30th, 2024 created with Blender. I made this visualization specifically for my (upcoming) book about creative data visualization, showing how you can look outside of the “standard” tools and software and be inspired by other fields to create captivating and unique visualizations of data.


I gave myself one week to learn Blender and create a unique and custom data visualization using a relatively simple dataset. It was frustrating at the start, as there is much to learn when starting to use Blender. However, the more time I spent fine-tuning the visual, the more I enjoyed the process. Especially when I got to play with materials and lighting and really see the reason I wanted to try Blender in the first place: that realistic result of 3D with shadows and a visual look that can’t be achieved using the more regular data visualization tools.

