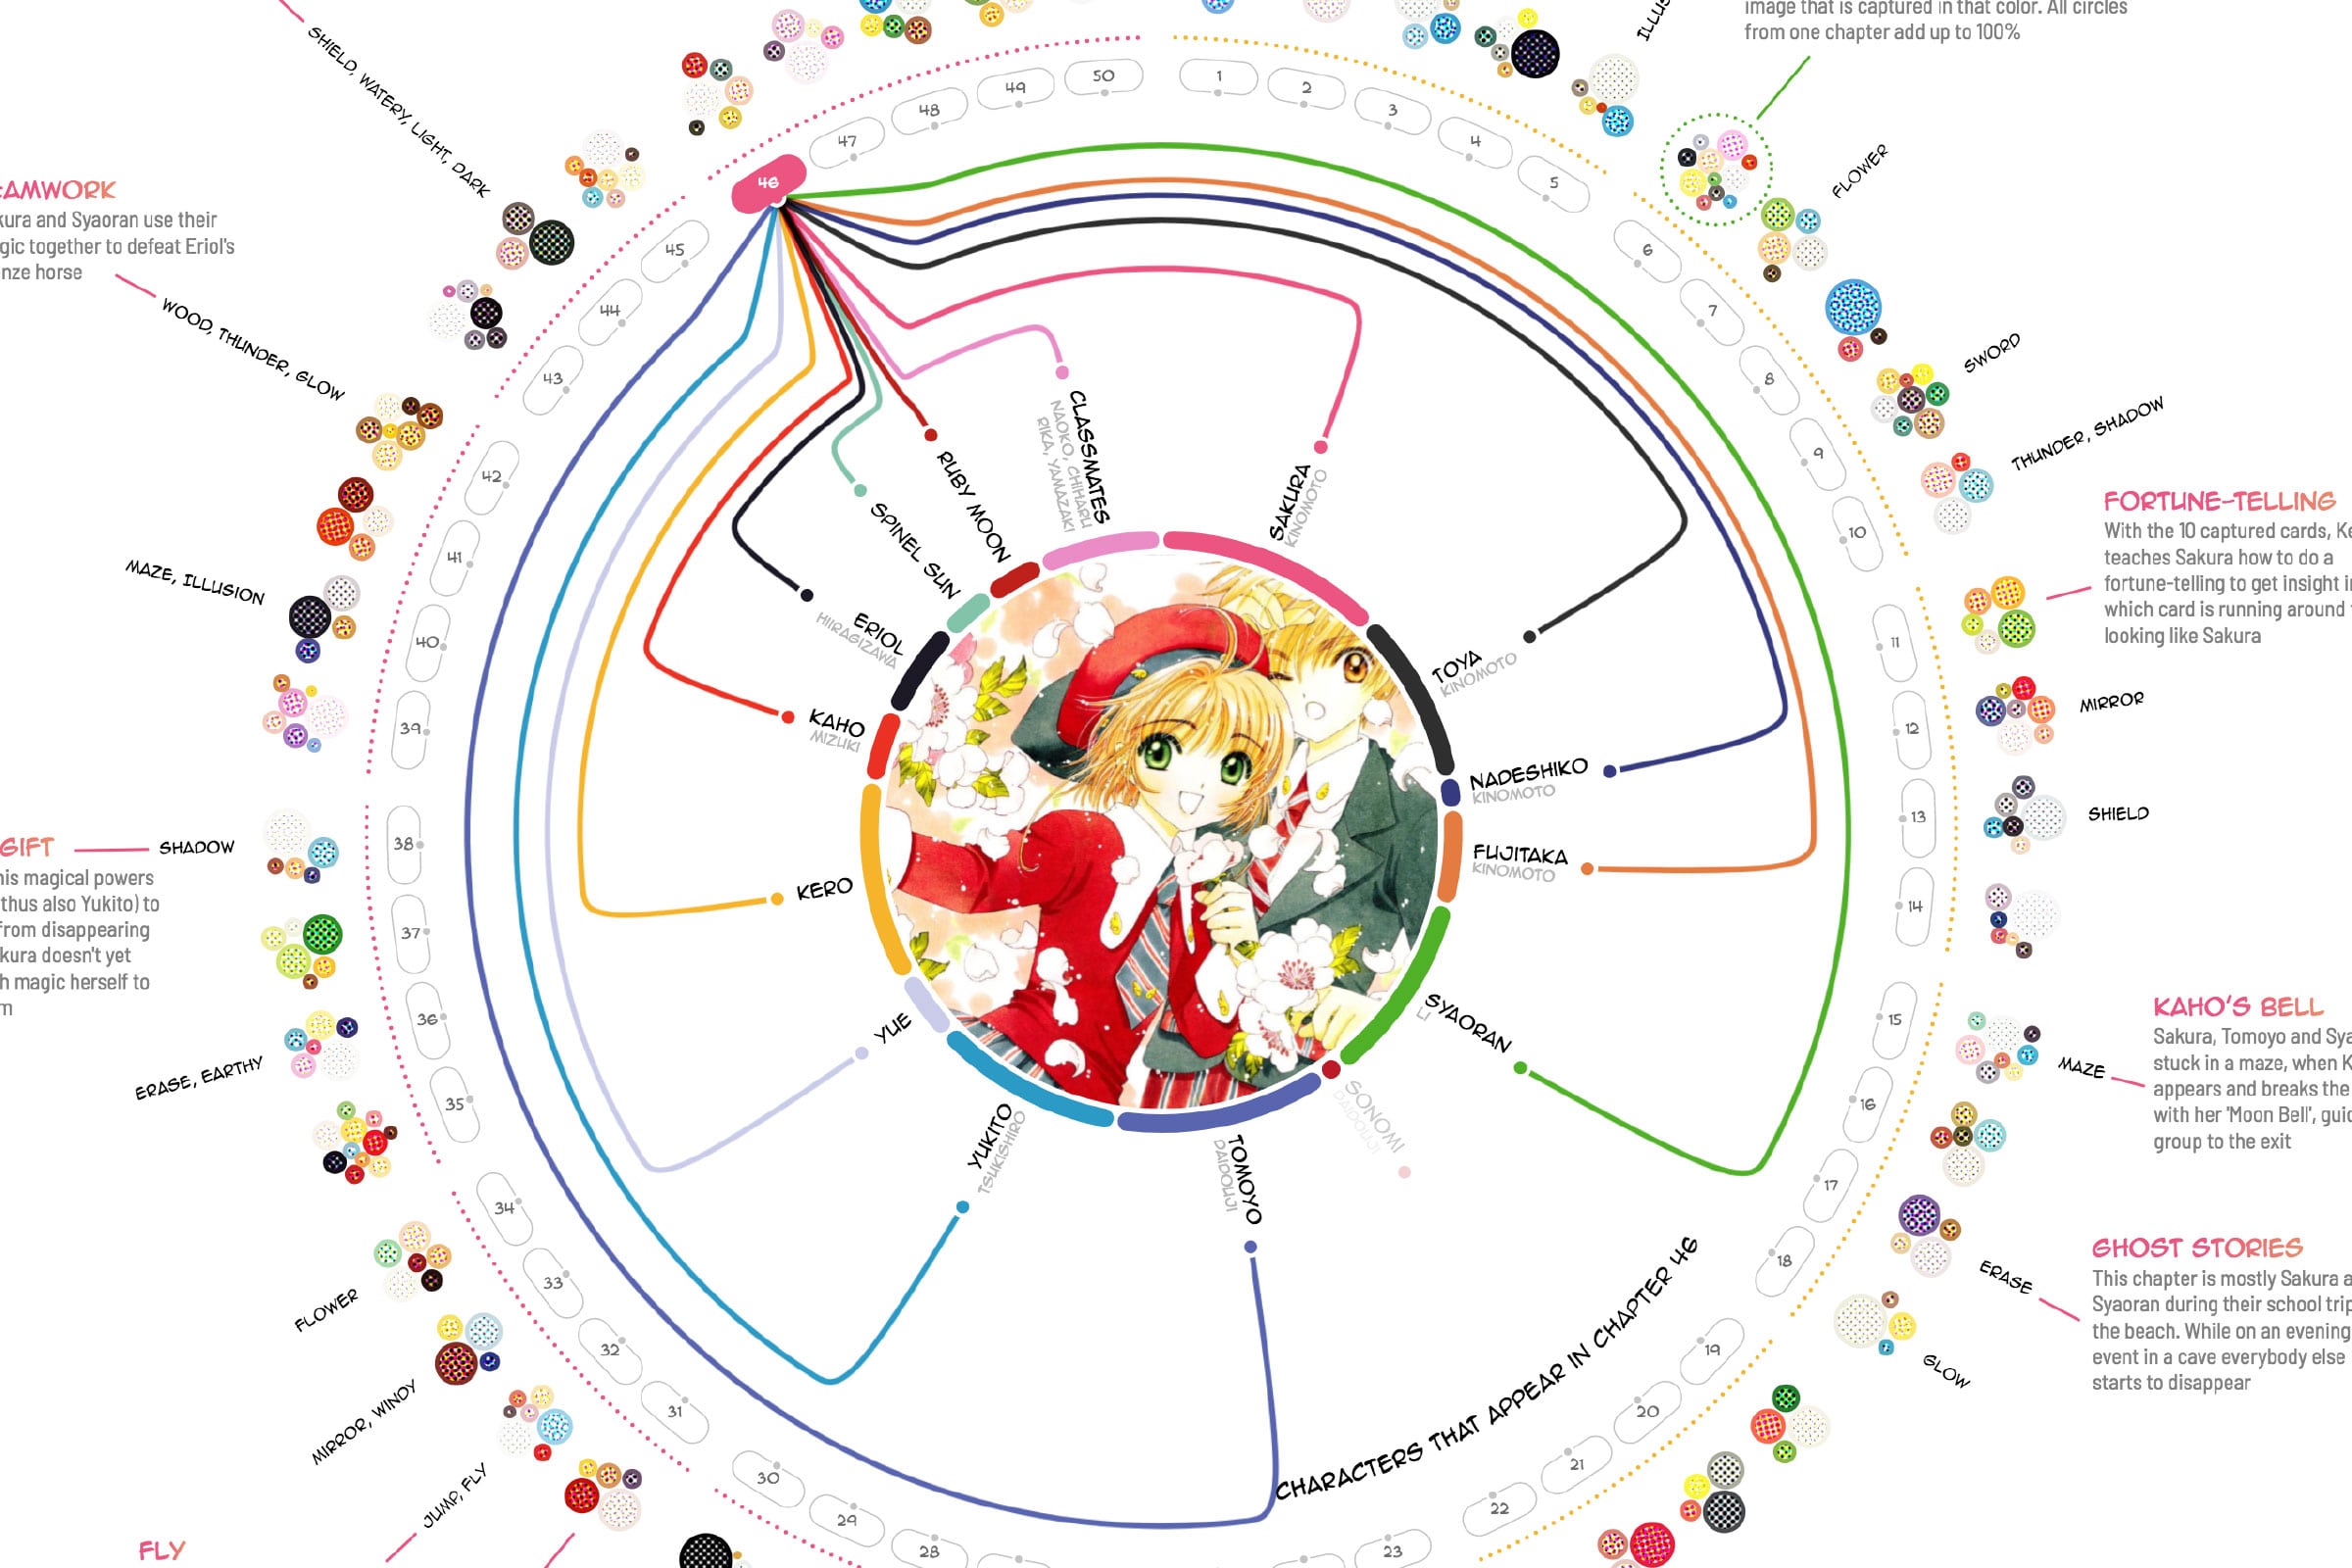
Cardcaptor Sakura is one of the most beautiful and adorable manga series ever created and this project is my ode to the wonderful series. CCS was written and illustrated by the manga artist group CLAMP between 1996 and 2000, but is still extremely popular today. This visualization brings together several different aspects of the series; the main characters, the chapters, relationships and the wonderful cover art of each of the 50 chapters. By visually connecting these different aspects of Cardcaptor Sakura, fans can get a more nuanced understanding of the events that happen throughout the series.
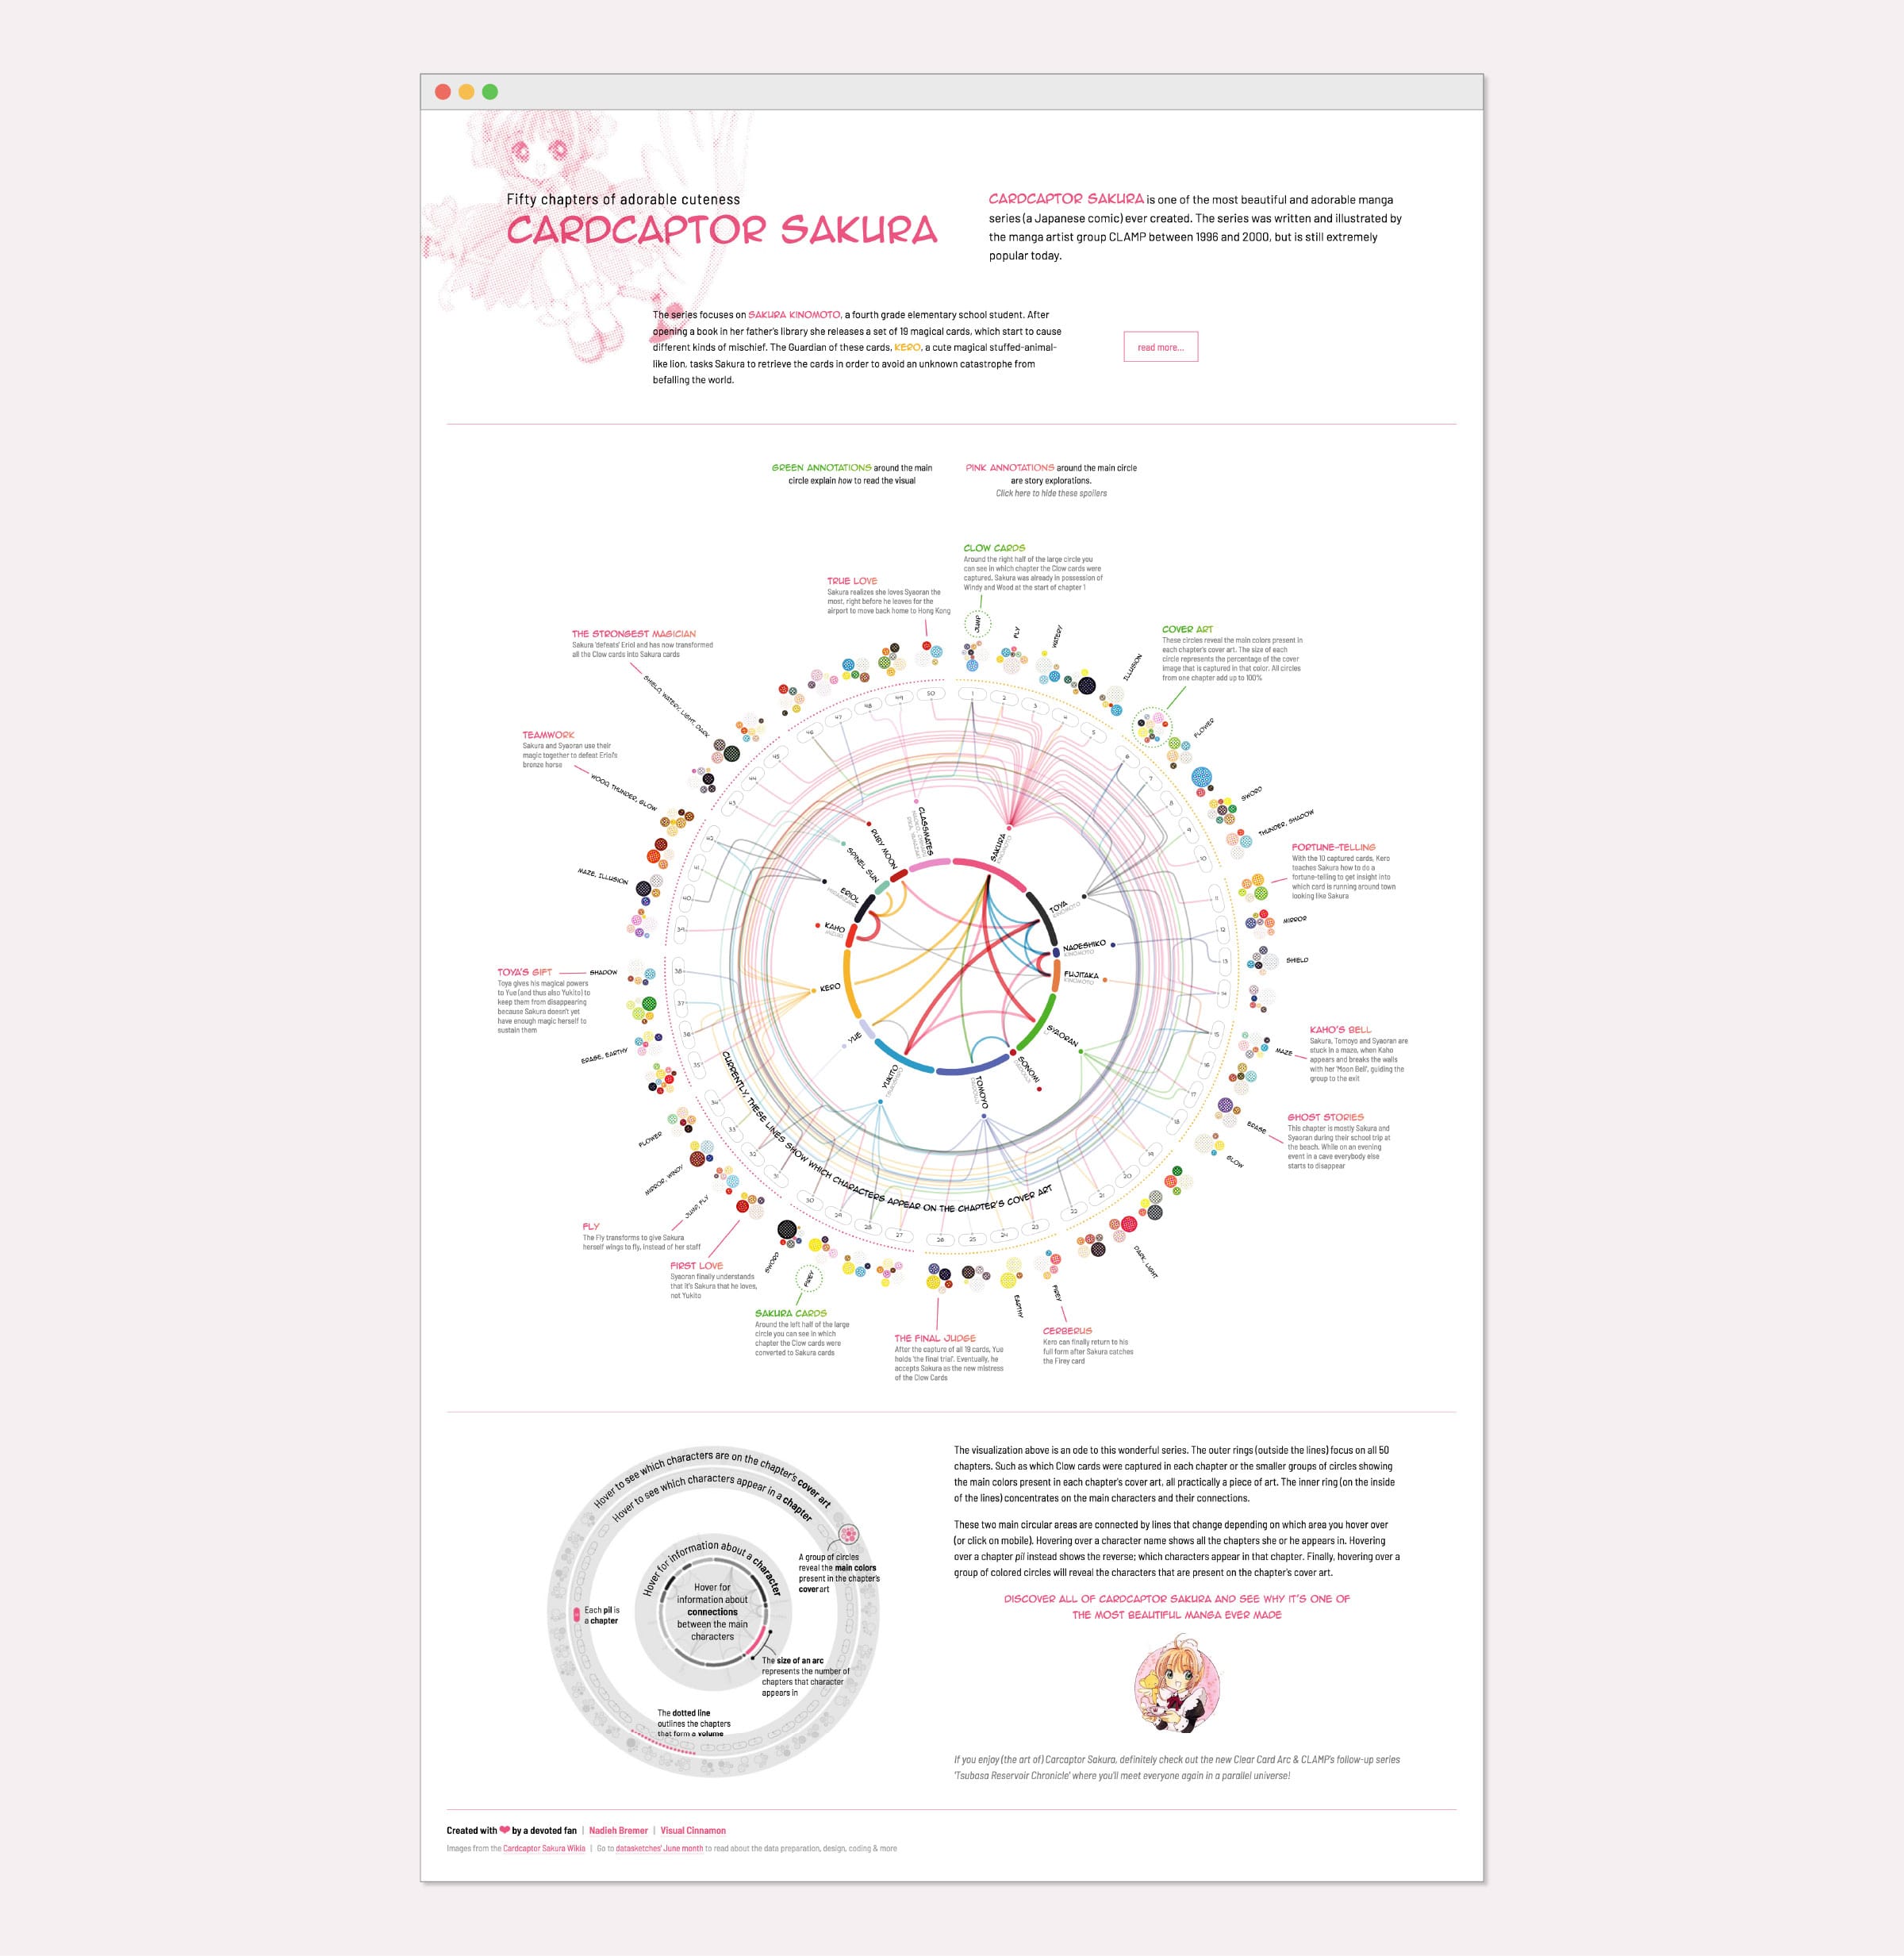
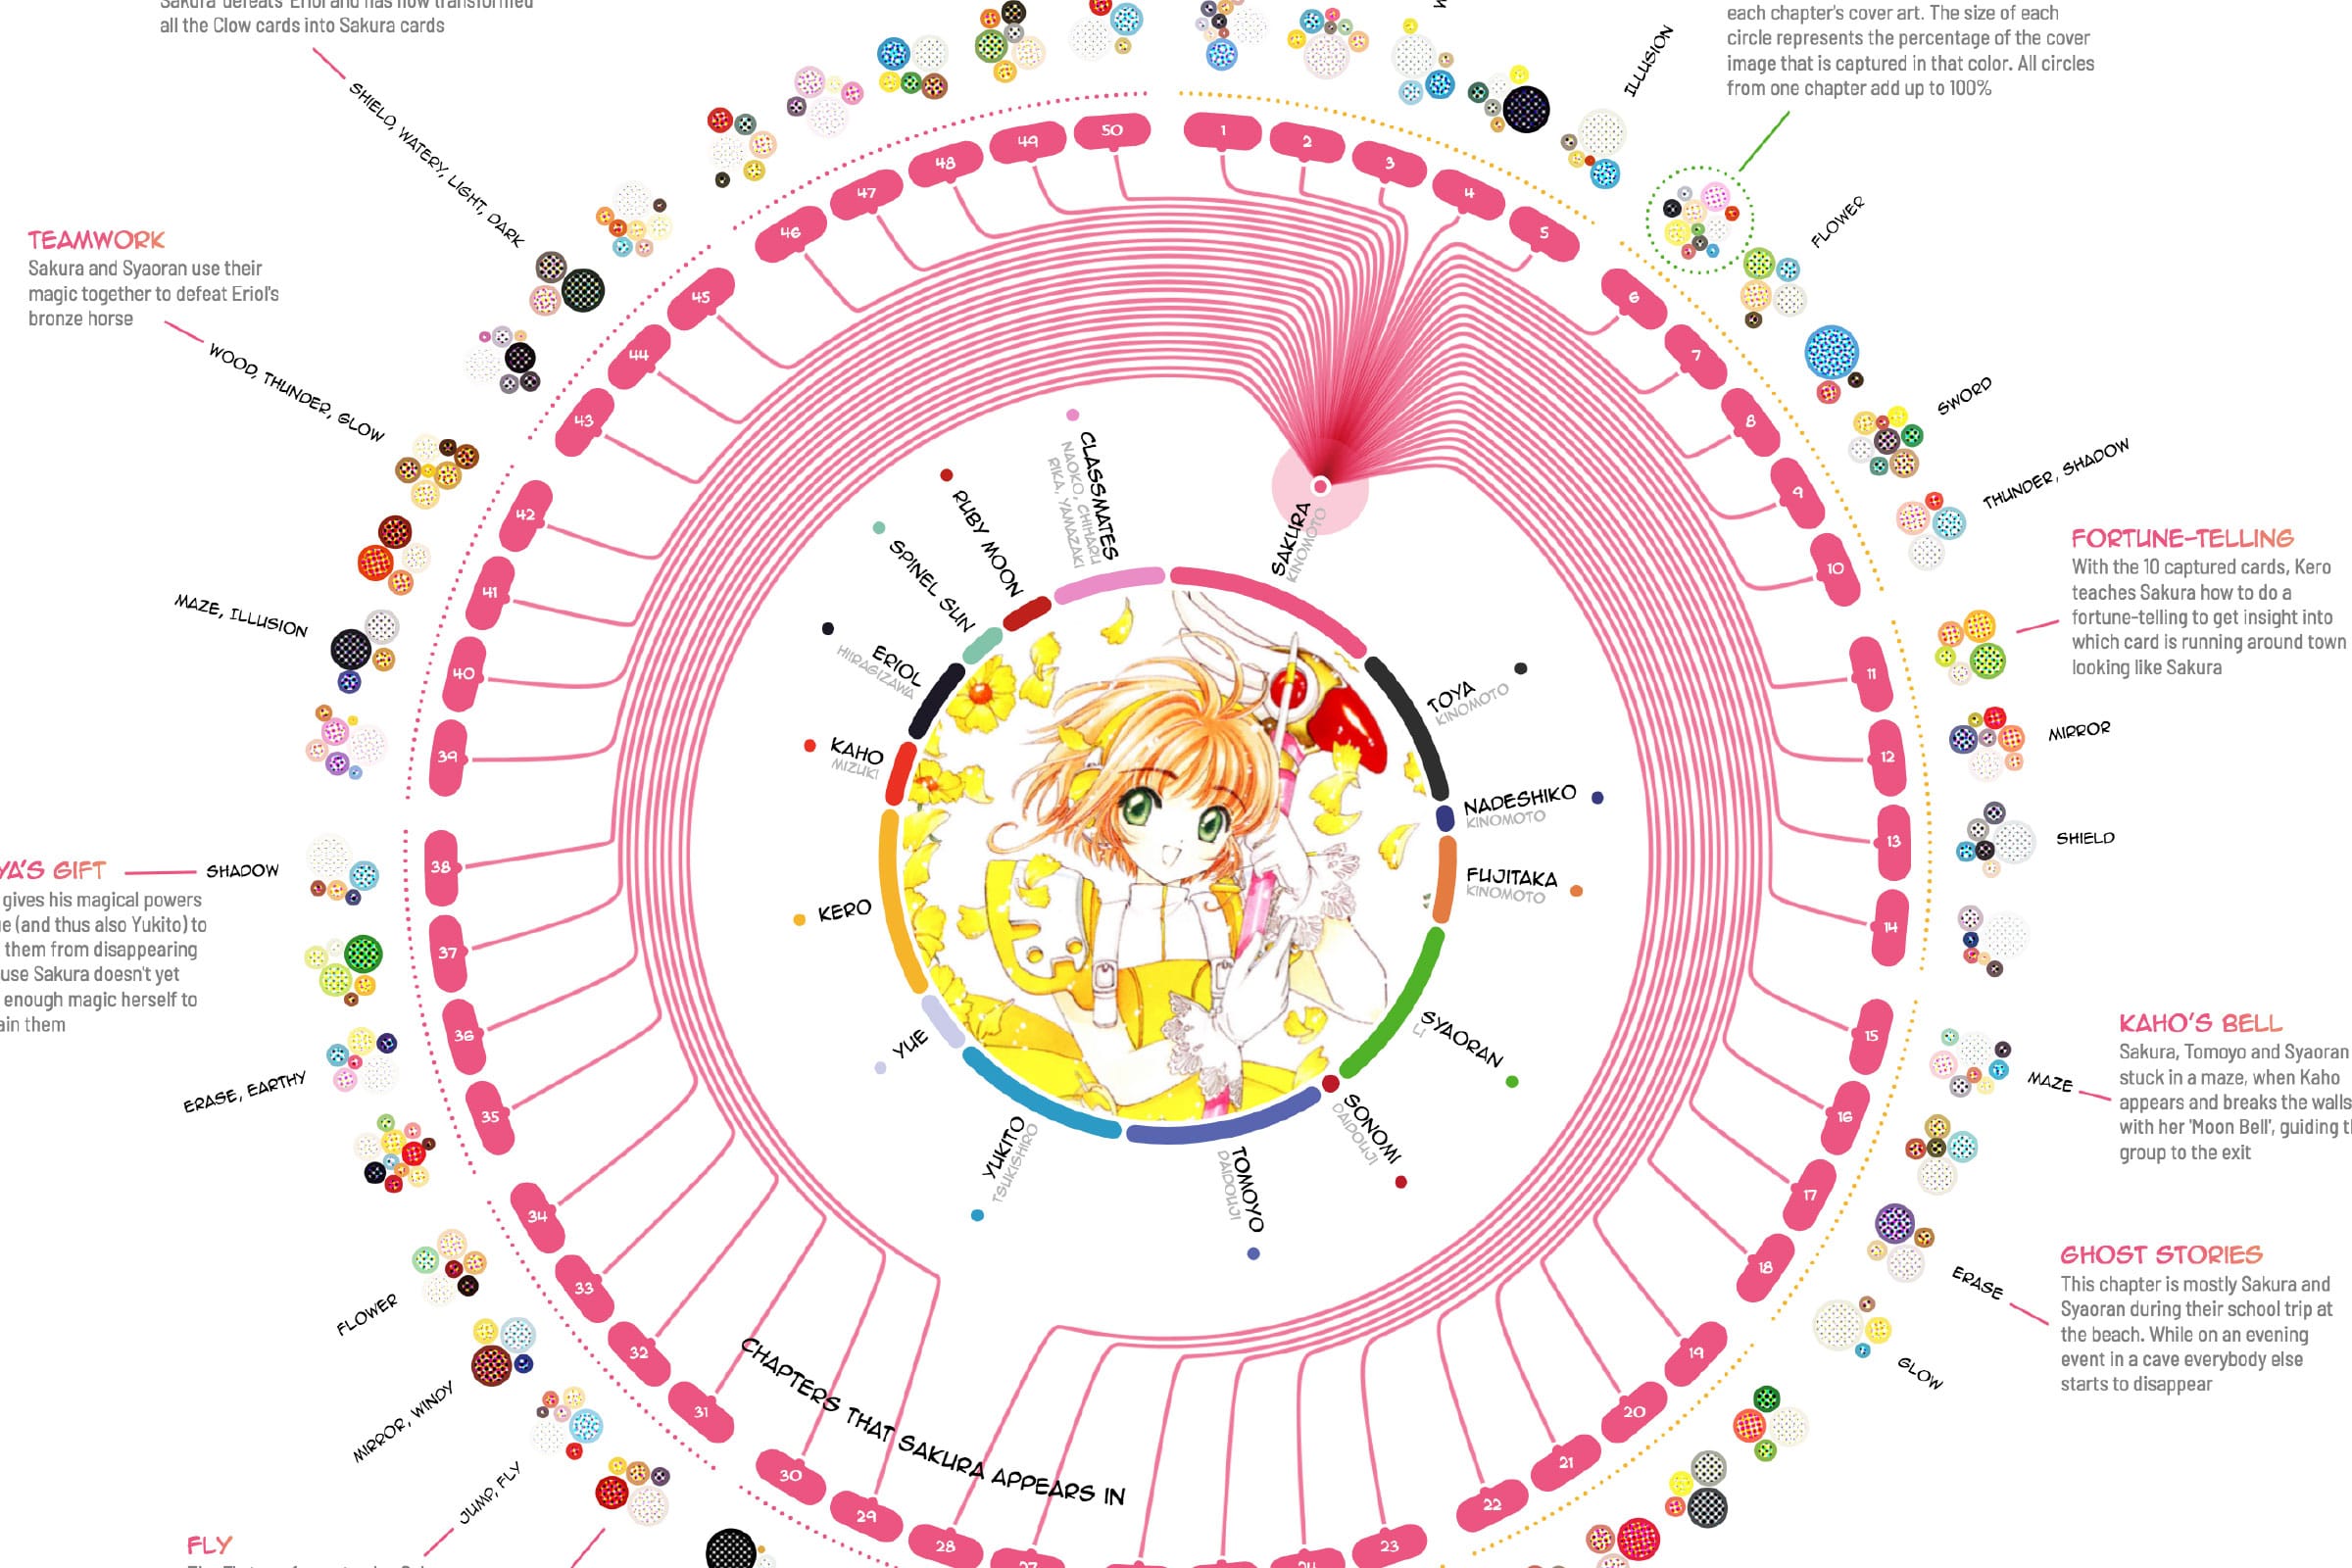
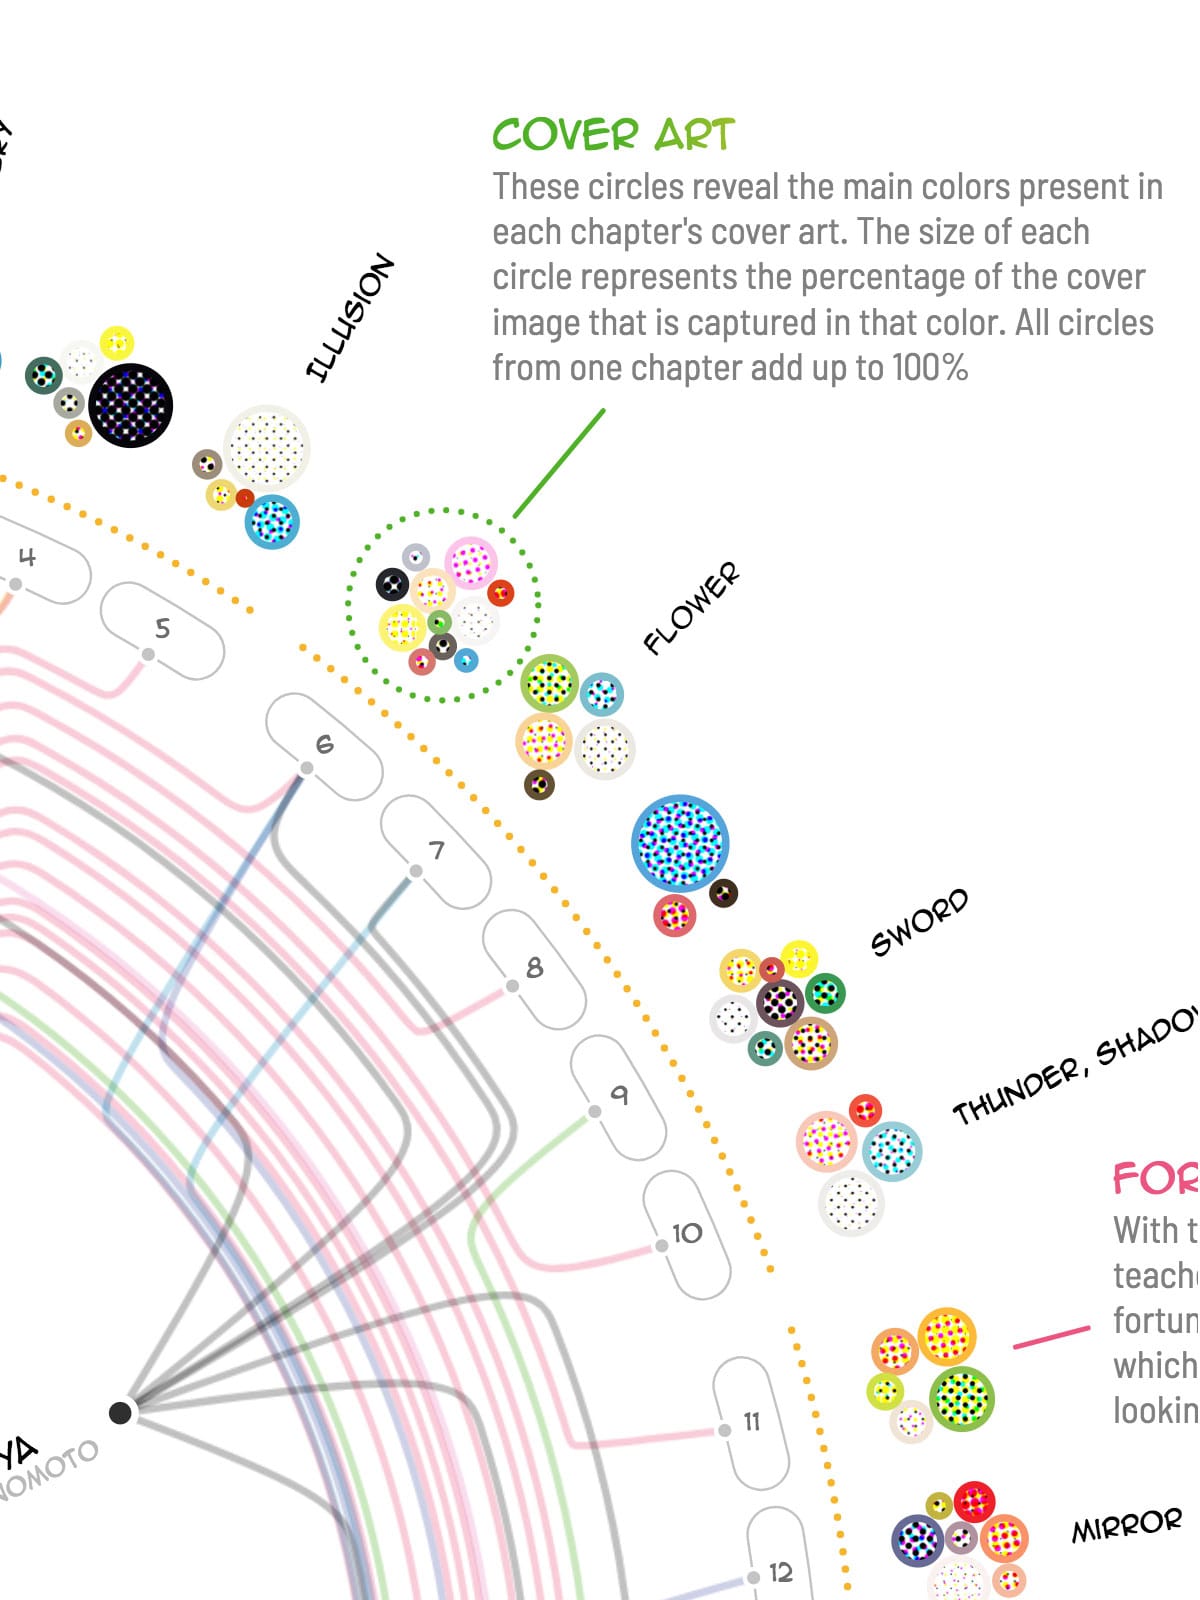
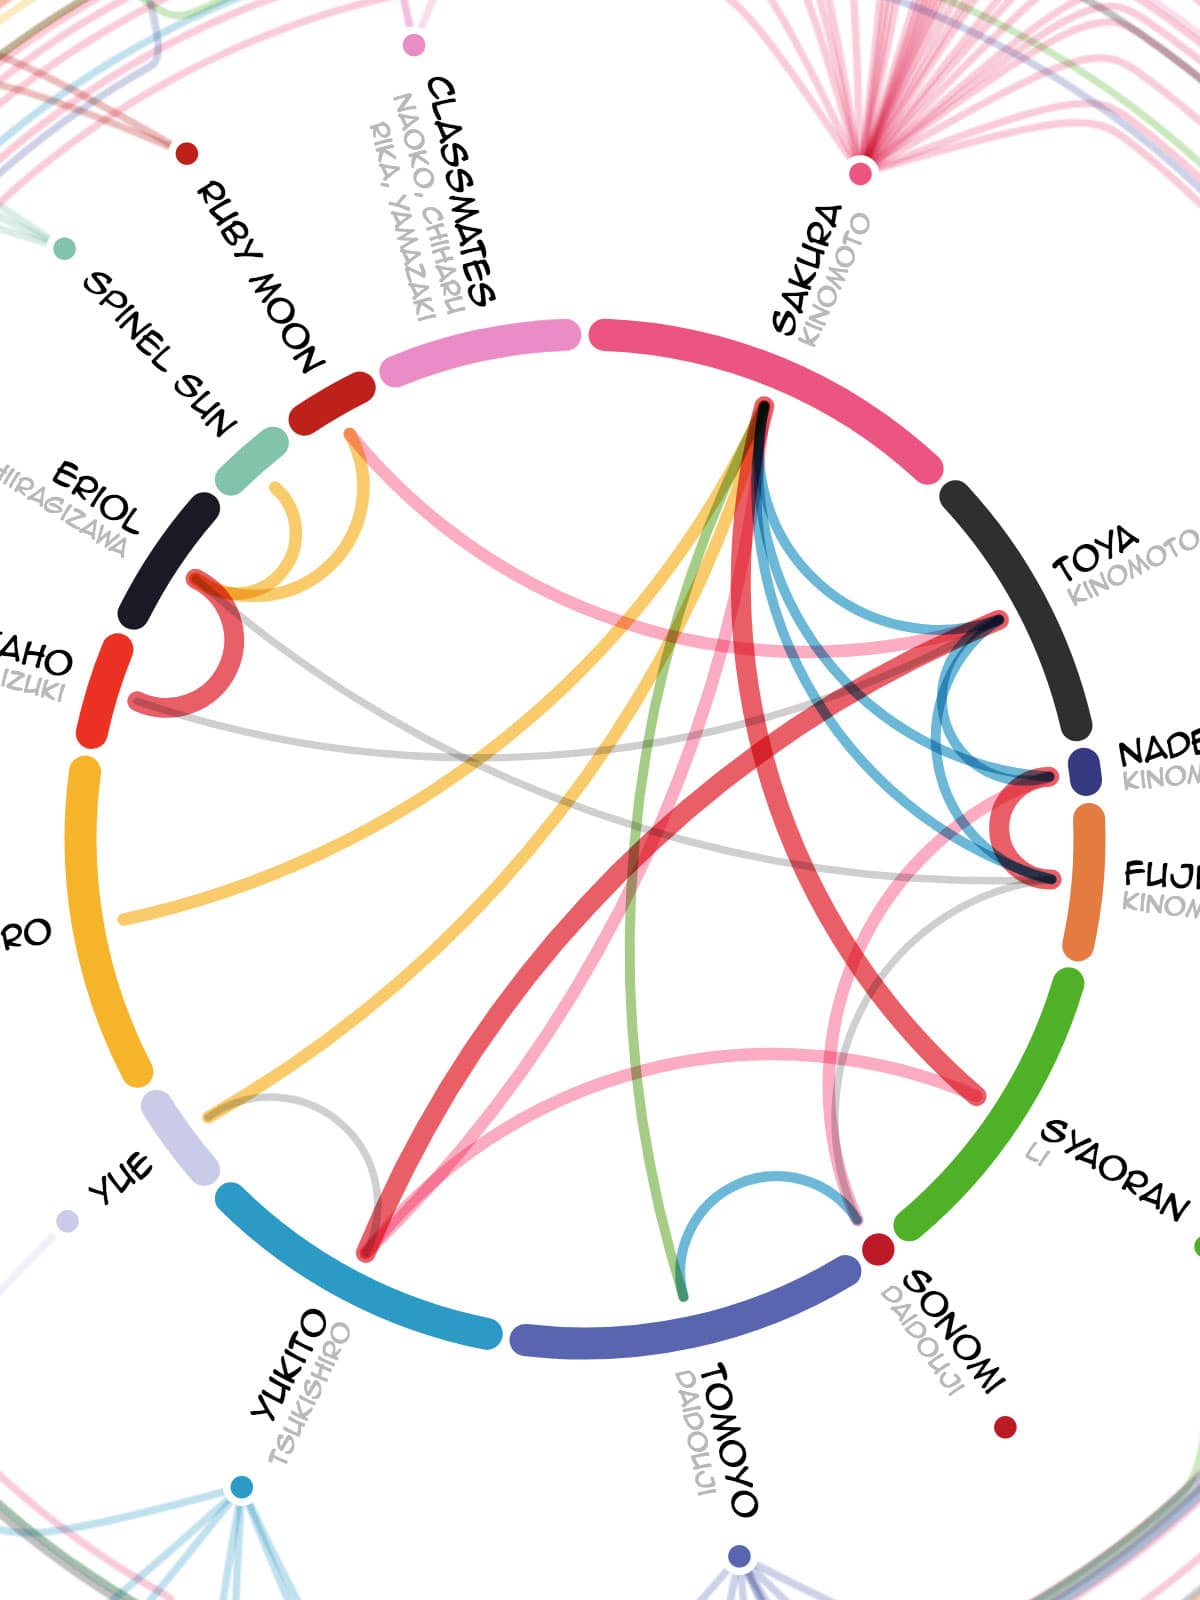
For our month of fun I wanted to do something about Cardcaptor Sakura, my favorite manga during my teens. Because the series features so many beautiful drawings, incorporating the visual part of the manga into the project seemed like a good starting point. I therefore wrote a script in R that analyzed the cover art of all 50 chapters to get their main colors.
Besides the colors, I felt it would be interesting to add extra information about which of the main characters appears in each chapter. But also what connections exist between the characters, since there are some interesting non-standard relations going on. Combining all of those insights eventually led me to the final onion layered design. In an abstract sense, it’s a double donut chart layout with a many custom SVG paths in between them.
If you’re interesting in learning more, you can read all about the data, design & coding on my data sketches’ June write-up.
